

Troubleshooting DAGs
Cloud Composer 3 | Cloud Composer 2 | Cloud Composer 1
This page provides troubleshooting steps and information for common workflowissues.
Many DAG execution issues are caused by non-optimal environment performance.You can optimize your environment by following theOptimize environment performance and costs guide.
Some DAG executions issues might be caused by the Airflow schedulernot working correctly or optimally. FollowScheduler troubleshooting instructionsto solve these issues.
Troubleshooting workflow
To begin troubleshooting:
Check theAirflow logs.
You can increase the logging level of Airflow by overriding thefollowing Airflow configuration option.
Note: Remember to revert the logging level back toINFOafter thetroubleshooting is completed. Log files are stored in your environment'sbucket; leaving the logging level atDEBUGmight increase costsassociated with Cloud Storage.Section Key Value logginglogging_levelThe default value is INFO.Set toDEBUGto get more verbosity in log messages.Check theMonitoring Dashboard.
Review theCloud Monitoring.
In Google Cloud console, check for errors on the pages forthecomponents of your environment.
In theAirflow web interface,check in the DAG'sGraph View forfailed task instances.
Tip: To navigate through a large DAG to look for failed task instances,change the graph view orientation from LR to RL byoverriding the following Airflow configuration option:Section Key Value webserverdag_orientationLR,TB,RL, orBT
Investigate Airflow task failures with Gemini Cloud Assist
Note: Cloud Composer supports Gemini Cloud Assistinvestigations for Airflow versions starting from Airflow 2.7.3.Gemini Cloud Assist investigations area root-cause analysis (RCA) tool for troubleshooting your infrastructure andapplications in complex and distributed cloud environments. Investigations canhelp you understand, diagnose, and resolve issues in Google Cloud. Withinvestigations, you can streamline incident response by reducing the time toresolution and improving your overall availability, all with less effort.
In Cloud Composer, you can start Gemini Cloud Assistinvestigations for failed Airflow tasksfrom the DAG UI. Cloud Composerautomatically populates details like the issue description and time range, andincludes your environment as a relevant resource.
Start and view investigations
To start a new Gemini Cloud Assist investigation for a failed Airflowtask, or to view an existing investigation:
In the Google Cloud console, go to theEnvironments page.
Select an environment to view its details.
On theEnvironment details page, go to theDAGs tab.
Click the name of a DAG.
On theDAG details page, go to theRun history tab and click a DAGrun that has failed tasks.
In theState column of the failed Airflow task, clickInvestigate:
- For a newly investigated task, clickInvestigate.
- If a task already has an investigation, clickView investigation toreview the existing investigation. As an alternative, you can startanother investigation by clickingNew investigation.
Proceed tocreating, running, and reviewing the investigationwith Gemini Cloud Assist.
Example investigation
This example shows a process of investigating a failing task.
On theMonitoring>DAG Statistics dashboard, observefailing DAG runs:
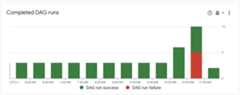
Figure 1. Completed DAG runs graph (click to enlarge) Navigate toDAGs. TheFailed runs (1h) column shows that the
create_large_txt_file_print_logsDAG had several failed runs in the pasthour. Click the name of the DAG.
Figure 2. List of DAGs with DAG run statistics (click to enlarge) Click one of the failed DAG runs, then clickInvestigate next to the failed Airflow task entry and start theinvestigation.
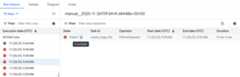
Figure 3. List of tasks in the failing DAGs (click to enlarge) Wait until the investigation is complete.
Therelevant observations list details the investigation process. Inthis particular example, the task failed without generating logs, butGemini Cloud Assist was able to find the cause of thefailure in the Airflow scheduler logs, where the task was terminated as azombie.
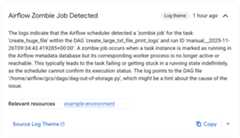
Figure 4. Zombie Job Detected observation (click to enlarge) Finally, Gemini Cloud Assist summarizes the findings and providesa hypothesis along with recommendations for fixing the issue. In thisexample, the task failed because an Airflow worker didn't have enoughresources to process it. This is supported by observations of the workerPod being restarted multiple times with an OOM error, and the task beingsubsequently terminated by the scheduler as a zombie task.
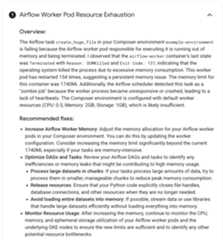
Figure 5. Airflow Worker Pod Resource Exhaustion hypothesis (click to enlarge)


Debugging operator failures
To debug an operator failure:
- Check for task-specific errors.
- Check theAirflow logs.
- Review theCloud Monitoring.
- Check operator-specific logs.
- Fix the errors.
- Upload the DAG to the
/dagsfolder. - In the Airflow web interface,clear the past states for the DAG.
- Resume or run the DAG.
Troubleshooting task execution
Airflow is a distributed system with many entities like scheduler, executor,workers that communicate to each other through a task queue and the Airflowdatabase and send signals (like SIGTERM). The following diagram shows anoverview of interconnections between Airflow components.

In a distributed system like Airflow there might be some network connectivityissues, or the underlying infrastructure might experience intermittent issues;this can lead to situations when tasks can fail and be rescheduled forexecution, or tasks might not be successfully completed (for example, Zombietasks, or tasks that got stuck in execution). Airflow has mechanisms to dealwith such situations and automatically resume the normal functioning. Followingsections explain common problems that occur during task execution by Airflow.
Troubleshooting KubernetesExecutor tasks
CeleryKubernetesExecutor is a type of executor in Cloud Composer 3that can use CeleryExecutor and KubernetesExecutor at the sametime.
See theUse CeleryKubernetesExecutor page for moreinformation about troubleshooting tasks executed with KubernetesExecutor.
Tasks fail without emitting any logs
Task fails without emitting logs because of DAG parsing errors
Sometimes there might be subtle DAG errors that lead to a situation wherethe Airflow scheduler can schedule tasks for execution, the DAG processor canparse the DAG file, but then the Airflow worker fails to execute tasksfrom the DAG because there are programming errors in the DAG file. This mightlead to a situation where an Airflow task is marked asFailedand there is nolog from its execution.
Solutions:
Verify in Airflow worker logs that there are no errors raised byAirflow worker that are related to a missing DAG or DAG parsing errors.
Increase parameters related to DAG parsing:
Increase[dagbag-import-timeout][ext-airflow-dagrun-import-timeout] to at least120 seconds (or more, if required).
Increasedag-file-processor-timeoutto at least 180 seconds (or more, if required). This value must behigher than
dagbag-import-timeout.
See alsoTroubleshooting DAG Processor issues.
Tasks are interrupted abruptly
During task execution, Airflow workers can abruptly terminate because of issues not specifically related to the task itself, seeCommon root causes for a list of such scenarios and possible solutions. The following sections coversome additional symptoms that could originate from those root causes:
Zombie tasks
Airflow detects two kinds of mismatch between a task and a process that executesthe task:
Zombie tasks are tasks that are supposed to be running but are notrunning. This might happen if the task's process was terminated or is notresponding, if the Airflow worker didn't report a task status in timebecause it is overloaded, or if VM where the task is executed was shut down.Airflow finds such tasks periodically, and either fails or retries the task,depending on the task's settings.
Note: When zombie tasks are present in an environment, it might appear thatthe number of running tasks exceeds the total capacity of Airflow workersbecause there is a delay in marking zombie tasks as non-running. Thisdoesn't happen in reality, the total capacity of Airflow workers isn'texceeded.Discover zombie tasks
resource.type="cloud_composer_environment"resource.labels.environment_name="ENVIRONMENT_NAME"log_id("airflow-scheduler")textPayload:"Detected zombie job"Undead tasks are tasks that are not supposed to be running. Airflow findssuch tasks periodically and terminates them.
SeeCommon root causes for additional information on how totroubleshoot Zombie tasks.
SIGTERM signals
SIGTERM signals are used by Linux,Kubernetes, Airflow scheduler and Celery to terminate processes responsible forrunning Airflow workers or Airflow tasks.
There might be several reasons why SIGTERM signals are sent in an environment:
A task became a Zombie task and must be stopped.
The scheduler discovered a duplicate of a task and sends Terminating instance and SIGTERM signals to the task to stop it.
InHorizontal Pod Autoscaling, the GKEControl Plane sends SIGTERM signals to remove Pods that are no longerneeded.
The scheduler can send SIGTERM signals to DagFileProcessorManager process.Such SIGTERM signals are used by the Scheduler to manageDagFileProcessorManager process lifecycle and can be safely ignored.
Example:
Launched DagFileProcessorManager with pid: 353002Sending Signals.SIGTERM to group 353002. PIDs of all processes in the group: []Sending the signal Signals.SIGTERM to group 353002Sending the signal Signals.SIGTERM to process 353002 as process group is missing.Race condition between the heartbeat callback and exit callbacks in thelocal_task_job, which monitors the execution of the task. If the heartbeatdetects that a task was marked as success, it cannot distinguish whetherthe task itself succeeded or that Airflow was told to consider the tasksuccessful. Nonetheless, it will terminate a task runner, without waitingfor it to exit.
Such SIGTERM signals can be safely ignored. The task is already in thesuccessful state and the execution of the DAG run as a whole will not beaffected.
The log entry
Received SIGTERM.is the only difference between the regularexit and the termination of task in the successful state.
Figure 7. Race condition between the heartbeat and exit callbacks (click to enlarge) An Airflow component uses more resources (CPU, memory) than permitted by thecluster node.
GKE service performs maintenance operations andsends SIGTERM signals to Pods that run on a node that is about to be upgraded.
When a task instance is terminated with SIGTERM, you can see the following logentries in the logs of an Airflow worker that executed the task:
{local_task_job.py:211} WARNING - State of this instance has been externallyset to queued. Terminating instance. {taskinstance.py:1411} ERROR - ReceivedSIGTERM. Terminating subprocesses. {taskinstance.py:1703} ERROR - Task failedwith exception

Possible solutions:
This issue happens when a VM that runs the task is out of memory. This is notrelated to Airflow configurations but to the amount of memory available to theVM.
In Cloud Composer 3, you can assign more CPU and memory resources toAirflow workers.
You can lower the value of the
[celery]worker_concurrencyconcurrencyAirflow configuration option. This option determines how many tasks areexecuted concurrently by a given Airflow worker.
For more information about optimizing your environment, seeOptimize environment performance and costs.
Airflow task was interrupted byNegsignal.SIGKILL
Sometimes your task might be using more memory than Airflow worker is allocated.In such a situation it might be interrupted byNegsignal.SIGKILL. The systemsends this signal to avoid further memory consumption which might impactthe execution of other Airflow tasks. In the Airflow worker's log you might seethe following log entry:
{local_task_job.py:102}INFO-TaskexitedwithreturncodeNegsignal.SIGKILLNegsignal.SIGKILL might also appear as code-9.
Possible solutions:
Lower
worker_concurrencyof Airflow workers.Increase the amount of memory available to Airflow workers.
Manage resource-intensive tasks in Cloud Composer by usingKubernetesPodOperator orGKEStartPodOperator fortask isolation and customized resource allocation.
Optimize your tasks to use less memory.
Task fails because of resource pressure
Symptom: during execution of a task, Airflow worker's subprocess responsiblefor Airflow task execution is interrupted abruptly.The error visible in Airflow worker's log might look similar to the one below:
...File "/opt/python3.8/lib/python3.8/site-packages/celery/app/trace.py", line 412, in trace_task R = retval = fun(*args, **kwargs) File "/opt/python3.8/lib/python3.8/site-packages/celery/app/trace.py", line 704, in __protected_call__ return self.run(*args, **kwargs) File "/opt/python3.8/lib/python3.8/site-packages/airflow/executors/celery_executor.py", line 88, in execute_command _execute_in_fork(command_to_exec) File "/opt/python3.8/lib/python3.8/site-packages/airflow/executors/celery_executor.py", line 99, in _execute_in_forkraise AirflowException('Celery command failed on host: ' + get_hostname())airflow.exceptions.AirflowException: Celery command failed on host: airflow-worker-9qg9x...Solution:
In Cloud Composer 3,increase memory limits for Airflow workers.
If your environment also generates zombie tasks, seeTroubleshooting Zombie tasks.
For a tutorial on debugging out of memory issues, seeDebug out of memory and out of storage DAG issues.
Task fails because of Pod eviction
Google Kubernetes Engine Pods are subject to theKubernetes Pod Lifecycle and Pod eviction.Task spikes is the most common cause for Pod eviction inCloud Composer.
Pod eviction can occur when a particular Pod overuses resources of a node,relative to the configured resource consumption expectations for the node. Forexample, eviction might happen when several memory-heavy tasks run in a Pod,and their combined load causes the node where this Pod runs to exceed thememory consumption limit.
If an Airflow worker Pod is evicted, all task instances running on thatPod are interrupted, and later are marked as failed by Airflow.
Logs are buffered. If a worker Pod is evicted before the buffer flushes, logsare not emitted. Task failure without logs is an indication that the Airflowworkers are restarted due to out-of-memory (OOM). Some logs might be presentin Cloud Logging even though the Airflow logs were not emitted.
To view logs:
In Google Cloud console, go to theEnvironments page.
In the list of environments, click the name of your environment.TheEnvironment details page opens.
Go to theLogs tab.
View logs of individual Airflow workers underAll logs>Airflow logs>Workers.
Solution:
Increase memory limitsfor Airflow workers.
Make sure that the tasks in the DAG are idempotent and retriable.
Avoid downloading unnecessary files to the local file system ofAirflow workers.
Airflow workers have limited local file system capacity.An Airflow worker can have from 1 GB to 10 GB of storage.When the storage space runs out, the Airflow worker Pod is evicted by theGKE Control Plane. This fails all tasks that the evictedworker was executing.
Examples, of problematic operations:
- Downloading files or objects and storing them locally in an Airflowworker. Instead, store these objects directly in a suitable servicesuch as a Cloud Storage bucket.
- Accessing big objects in the
/datafolder from an Airflow worker.The Airflow worker downloads the object into its local filesystem.Instead, implement your DAGs so that large files are processed outsideof the Airflow worker Pod.
Common root causes
Airflow worker ran out of memory
Each Airflow worker can run up to[celery]worker_concurrency task instancessimultaneously. If a cumulative memory consumption of those task instancesexceeds the memory limit for an Airflow worker, a random process on it isterminated to free up resources.
Sometimes, the shortage of memory on an Airflow worker can lead to malformedpackets being sent during an SQL Alchemy session to the database, to a DNSserver or to any other service called by a DAG. In this case the other end ofthe connection might reject or drop connections from the Airflow worker.For example:
"UNKNOWN:Error received from peer{created_time:"2024-11-31T10:09:52.217738071+00:00", grpc_status:14,grpc_message:"failedtoconnecttoalladdresses;lasterror:UNKNOWN:ipv4:<ipaddress>:443:handshakershutdown"}"Solutions:
Note: Out-of-memory issues on particular Airflow workerscan't be prevented byautoscaling.Optimize tasks to use less memory, for example, byavoiding top level code.
Decrease
[celery]worker_concurrency.Increase memory for Airflow workers toaccommodate
[celery]worker_concurrencychanges.
Airflow worker was evicted
Pod evictions are a normal part of running workloads on Kubernetes.GKE evicts pods if they ran out of storage or to freeup resources for workloads with a higher priority.
Solutions:
- If an eviction is caused by the lack of storage, you can reduce the storageusage or remove temporary files as soon as they aren't needed.As an alternative, you canincrease available storage or runworkloads in a dedicated podwith
KubernetesPodOperator.
Airflow worker was terminated
Airflow workers might be removed externally. If currently running tasks don'tfinish during a graceful termination period, they are interrupted and mightend up being detected as zombies.
Possible scenarios and solutions:
Airflow workers are restarted during environment modifications, such asupgrades or package installation:
Discover Composer environment modifications
resource.type="cloud_composer_environment"resource.labels.environment_name="ENVIRONMENT_NAME"log_id("cloudaudit.googleapis.com%2Factivity")You can perform such operations when no critical tasks are running or enabletask retries.
Various components might be temporarily unavailable during maintenanceoperations.
You canspecify maintenance windows to minimizeoverlaps with the critical tasks execution.
Airflow worker was under heavy load
The amount of CPU and memory resources available to an Airflow worker is limitedby the environment's configuration. If the resource utilization gets closer tothe limits, it might cause a resource contention and unnecessary delays duringthe task execution. In the extreme situations, when resources lack duringlonger periods of time, this might cause zombie tasks.
Solutions:
- Monitor workers CPU and memory usage and adjust it to avoidexceeding 80%.
Airflow database was under heavy load
A database is used by various Airflow components to communicate to each otherand, in particular, to store heartbeats of task instances. Resource shortage onthe database leads to longer query times and might affect task execution.
Sometimes, the following errors are present in an Airflow worker's logs:
(psycopg2.OperationalError)connectiontoserverat<IPaddress>,port3306failed:serverclosedtheconnectionunexpectedlyThisprobablymeanstheserverterminatedabnormallybeforeorwhileprocessingtherequest.Solutions:
- Avoid using a lot of
Variables.getinstructions in your top-level DAG code.Instead, use Jijna templates for retrieving values of Airflow variables. - Optimize (reduce) the usage of xcom_push and xcom_pull instructions in JinjaTemplates in top-level DAG code.
- Consider upgrading to a larger environment size (Medium or Large).
- Lower the number of schedulers
- Lower the frequency of DAG parsing.
- Monitor the database CPU and memory usage.
Airflow database was temporarily unavailable
An Airflow worker might take time to detect and gracefully handle intermittenterrors, such as temporary connectivity issues. It might exceed the defaultzombie detection threshold.
Discover Airflow heartbeat timeouts
resource.type="cloud_composer_environment"resource.labels.environment_name="ENVIRONMENT_NAME"log_id("airflow-worker")textPayload:"Heartbeat time limit exceeded"Solutions:
Increase the timeout for zombie tasks andoverride thevalue of the
[scheduler]scheduler_zombie_task_thresholdAirflow configuration option:Section Key Value Notes schedulerscheduler_zombie_task_thresholdNewtimeout(inseconds) The defaultvalue is 300
Tasks fail because an error happened during execution
Terminating instance
Airflow uses theterminating instance mechanism to shut down Airflow tasks.This mechanism is used in the following situations:
- When a scheduler terminates a task that did not complete on time.
- When a task times out or is executed for too long.
When Airflow terminates task instances, you can see the following log entries in the logs of an Airflow worker that executed the task:
INFO - Subtask ... WARNING - State of this instance has been externally set to success. Terminating instance. INFO - Subtask ... INFO - Sending Signals.SIGTERM to GPID <X> INFO - Subtask ... ERROR - Received SIGTERM. Terminating subprocesses.Possible solutions:
Check the task code for errors that might cause it to run for too long.
Increase the CPU and memory for Airflowworkers, so that tasks execute faster.
Increase the value of the
[celery_broker_transport_options]visibility_timeoutAirflow configurationoption.As a result, the scheduler waits longer for a task to be finished,before considering the task to be a Zombie task. This option is especiallyuseful for time-consuming tasks that last many hours. Ifthe value is too low (for example, 3 hours), then the scheduler considerstasks that run for 5 or 6 hours as "hanged" (Zombie tasks).
Increase the value of the
[core]killed_task_cleanup_timeAirflowconfiguration option.A longer value provides more time to Airflow workers to finish their tasksgracefully. If the value is too low, Airflow tasks might be interruptedabruptly, without enough time to finish their work gracefully.
DAG execution does not end within expected time
Symptom:
Sometimes a DAG run does not end because Airflow tasks get stuck and DAG runlasts longer than expected. Under normal conditions, Airflow tasks do not stayindefinitely in the queued or running state, because Airflow has timeout andcleanup procedures that help avoid this situation.
Fix:
Use the
dagrun_timeoutparameter for the DAGs.For example:dagrun_timeout=timedelta(minutes=120). As a result, each DAGrun must be finished within the DAG run timeout. For more information aboutAirflow task states, seeApache Airflow documentation.Use thetask execution timeoutparameter to define a default timeout for tasks that run based on ApacheAirflow operators.
Lost connection to Postgres server during query exception is thrown during the task execution or right after it
Lost connection to Postgres server during query exceptionsoften happen when the following conditions are met:
- Your DAG uses
PythonOperatoror a custom operator. - Your DAG makes queries to the Airflow database.
If several queries are made from a callable function, tracebacks mightincorrectly point toself.refresh_from_db(lock_for_update=True) line in theAirflow code; it is the first database query after the task execution. Theactual cause of the exception happens before this, when an SQLAlchemy sessionis not properly closed.
SQLAlchemy sessions are scoped to a thread and created in a callable functionsession can be later continued inside the Airflow code. If there are significantdelays between queries within one session, the connection might be alreadyclosed by the Postgres server. The connection timeout inCloud Composer environments is set to approximately 10 minutes.
Solution:
- Use the
airflow.utils.db.provide_sessiondecorator. This decoratorprovides a valid session to the Airflow database in thesessionparameter and correctly closes the session at the end of the function. - Do not use a single long-running function. Instead, move all databasequeries to separate functions, so that there are multiple functions withthe
airflow.utils.db.provide_sessiondecorator. In this case, sessionsare automatically closed after retrieving query results.
Transient interruptions when connecting to Airflow Metadata DB
Cloud Composer runs on top of a distributed infrastructure. It meansthat from time to time some transient issues may appear and they mightinterrupt execution of your Airflow tasks.
In such situations you might see the following error messages in Airflow workers' logs:
"Can't connect to Postgres server on 'airflow-sqlproxy-service.default.svc.cluster.local' (111)"
or
"Can't connect to Postgres server on 'airflow-sqlproxy-service.default.svc.cluster.local' (104)"
Such intermittent issues might be also caused by maintenance operationsperformed for your Cloud Composer environments.
Usually such errors are intermittent and if your Airflow tasks are idempotentand you have retries configured, they do not affect you. You can alsoconsiderdefining maintenance windows.
One additional reason for such errors might be the lack of resources in yourenvironment's cluster. In such cases, you might scale up or optimize yourenvironment as described inScaling environments orOptimizing your environment instructions.
A DAG run is marked as successful but has no executed tasks
If a DAG runexecution_date is earlier than the DAG'sstart_date thenyou might see DAG runs that don't have any task runs, but are still marked as successful.

Cause
This situation might happen in one of the following cases:
A mismatch is caused by the timezone difference between the DAG's
execution_dateandstart_date. It might happen, for example, whenusingpendulum.parse(...)to setstart_date.The DAG's
start_dateis set to a dynamic value, for exampleairflow.utils.dates.days_ago(1)
Solution
Make sure that
execution_dateandstart_dateare using the same timezone.Specify a static
start_dateand combine it withcatchup=Falseto avoidrunning DAGs with past start dates.
Best Practices
Impact of update or upgrade operations on Airflow task executions
Update or upgrade operations interrupt currently executing Airflow tasks,unless a task is executed in thedeferrable mode.
We recommend to perform these operations when you expect minimal impacton Airflow task executions and set up appropriate retry mechanisms in yourDAGs and tasks.
Do not schedule programmatically generated DAGs at the same time
Generating DAG objects programmatically from a DAG file is an efficient methodto author many similar DAGs that only have small differences.
It's important to not schedule all such DAGs for execution immediately. Thereis a high chance that Airflow workers do not have enough CPU and memoryresources to execute all tasks that scheduled at the same time.
To avoid issues with scheduling programmatic DAGs:
- Increase worker concurrency and scale up your environment, so that it canexecute more tasks simultaneously.
- Generate DAGs in a way to distribute their schedules evenly over time, toavoid scheduling hundreds of tasks at the same time, so that Airflow workershave time to execute all scheduled tasks.
Controlling execution time of DAGs, tasks and parallel executions of the same DAG
If you want to control how long a single DAG execution for a particular DAGlasts, then you can use thedagrun_timeout DAGparameter to do so. For example, if you expect that a single DAG run (irrespective, whether execution finishes with success or failure) must not lastlonger than 1 hour, then set this parameter to 3600 seconds.
You can also control how long you allow for a single Airflow task to last. To doso, you can useexecution_timeout.
If you want to control how many active DAG runs you want to have for aparticular DAG then you can use the[core]max-active-runs-per-dagAirflow configuration option to do so.
If you want to have only a single instance of a DAG run in a given moment, setmax-active-runs-per-dag parameter to1.
Avoid increased network traffic to and from the Airflow database
The amount of traffic network between your environment's GKEcluster and the Airflow database depends on the number of DAGs, number oftasks in DAGs, and the way DAGs access data in the Airflow database. Thefollowing factors might influence the network usage:
Queries to the Airflow database. If your DAGs do a lot of queries, theygenerate large amounts of traffic. Examples: checking the status of tasksbefore proceeding with other tasks, querying the XCom table, dumping Airflowdatabase content.
Large number of tasks. The more tasks are there to schedule, the morenetwork traffic is generated. This consideration applies both to the totalnumber of tasks in your DAGs and to the scheduling frequency. When theAirflow scheduler schedules DAG runs, it makes queries to the Airflowdatabase and generates traffic.
Airflow web interface generates network traffic because it makes queries tothe Airflow database. Intensively using pages with graphs, tasks, anddiagrams can generate large volumes of network traffic.
What's next
Except as otherwise noted, the content of this page is licensed under theCreative Commons Attribution 4.0 License, and code samples are licensed under theApache 2.0 License. For details, see theGoogle Developers Site Policies. Java is a registered trademark of Oracle and/or its affiliates.
Last updated 2025-12-15 UTC.