

Understand performance
This page describes the approximate performance that Bigtable canprovide under optimal conditions, factors that can affect performance, and tipsfor testing and troubleshooting Bigtable performance issues.
Performance for typical workloads
Bigtable delivers highly predictable performance that is linearlyscalable. When you avoid thecauses of slower performance described on this page, each Bigtable node can provide thefollowing approximate throughput, depending on which type of storage thecluster uses:
| Storage Type | Reads | Writes | Scans | ||
|---|---|---|---|---|---|
| SSD | up to 17,000 rows per second | or | up to 14,000 rows per second | or | up to 220 MBps |
| HDD | up to 500 rows per second | or | up to 10,000 rows per second | or | up to 180 MBps |
| Infrequent access storage | up to 100 rows per second | or | up to 10,000 rows per second | or | up to 36 MBps |
These estimates assume each row contains 1 KB.
In general, a cluster's performance scales linearly as you add nodes to thecluster. For example, if you create an SSD cluster with 10 nodes, the clustercan support up to 140,000 rows per second for a typical read-only or write-onlyworkload.
Note: These performance numbers areestimates only, and they reflect aread-only or write-only workload. Bigtable performance is highlydependent on workload, schema design, and dataset characteristics. Theseperformance numbers can help as a starting point when you're estimating yourcompute needs, but they shouldn't be used for exact cluster sizing or forcost estimates.Plan your Bigtable capacity
When planning your Bigtable clusters, decide whether you want tooptimize for latency or throughput. For example, for a batch data processingjob, you might care more about throughput and less about latency. In contrast,for an online service that serves user requests, you might prioritize lowerlatency over throughput. You can achieve the numbers in thePerformance fortypicalworkloads section when you optimize for throughput.
CPU utilization
In almost all cases, we recommend that you use autoscaling, which letsBigtable add or remove nodes based on usage. For more information,seeAutoscaling.
Use the following guidelines when configuring your autoscaling targets or if youchoose manual node allocation. These guidelines apply regardless of thenumber of clusters your instance has. For a cluster with manual node allocation,you must monitor the cluster's CPU utilization with the goal of keeping CPUutilization below these values for optimal performance.
| Optimization goal | Maximum CPU utilization |
|---|---|
| Throughput | 90% |
| Latency | 60% |
For more information on monitoring, seeMonitoring.
Storage utilization
Storage is another consideration in capacity planning. The storage capacity of acluster is determined by the storage type and the number of nodes in thecluster. When the amount of data stored in a cluster increases,Bigtable optimizes storage bydistributing dataacross all nodes in the cluster.
You can determine the storage usage per node by dividing the cluster'sstorageutilization (bytes) by the number of nodes in the cluster. Forexample, consider a cluster that has three HDD nodes and 9 TB of data. Each nodestores about 3 TB, which is 18.75% of the HDD storage per node limit of 16 TB.
When storage utilization increases, workloads can experience an increase inquery processing latency even if the cluster has enough nodes to meet overallCPU needs. This is because the higher the storage per node, the more backgroundwork such as indexing is required. The increase in background work to handlemore storage can result in higher latency and lower throughput.
Start with the following when configuring your autoscaling settings. If youchoose manual node allocation, monitor the cluster's storage utilization andadd or remove nodes to maintain the following.
| Optimization goal | Maximum storage utilization |
|---|---|
| Throughput | 70% |
| Latency | 60% |
For more information, seeStorage per node.
Run your workloads against Bigtable
Always run your workloads against a Bigtablecluster when doing capacity planning to determine the best resource allocationfor your applications.
Google'sPerfKit Benchmarker usesYCSB to benchmark cloudservices. You can follow thePerfKitBenchmarker tutorial for Bigtableto create tests for your workloads. When doing so, tune theparameters in the benchmarking config YAML files to ensure thegenerated benchmark reflects the following production characteristics:
- Total size of your table (proportional, but at least 100 GB).
- Row data shape (row key size, number of columns, row data sizes, etc.)
- Data access pattern (row key distribution)
- Mixture of reads against writes
Refer toTesting performance with Bigtable for morebest practices.
Causes of slower performance
The following factors can cause Bigtable to perform moreslowly than estimated:
- You read a large number of non-contiguous row keys or row ranges in a singleread request. Bigtable scans the table and reads the requestedrows sequentially. This lack of parallelism affectsoverall latency, andreads hitting ahot node can increasetail latency. SeeReads and performance for details.
- Your table's schema is not designed correctly. To get good performance fromBigtable, it's essential to design a schema that makes it possibleto distribute reads and writes evenly across each table. Additionally, hotspotsin one table can affect the performance of other tables in the same instance.SeeSchema design best practices for more information.
- The rows in your Bigtable table contain large amounts ofdata. The performance estimates assume that each row contains1 KB of data. You can read and write larger amounts of dataper row, but increasing the amount of data per row will also reduce the numberof rows per second.
- The rows in your Bigtable table contain a very large number ofcells. It takes time for Bigtable to process each cell in a row. Also, each cell adds someoverhead to the amount of data that's stored in your table and sent over the network. For example,if you're storing 1 KB (1,024 bytes) of data, it's much more space-efficient to store that data in asingle cell, rather than spreading the data across 1,024 cells that each contain 1 byte. If you split your data across more cellsthan necessary, you might not get the best possible performance. If rows containa large number of cells because columns contain multiple timestamped versions ofdata, considerkeeping only the most recent value. Anotheroption for an existing table is to send a deletion for all previousversions with each rewrite.
The cluster doesn't have enough nodes. A cluster's nodes provide computefor the cluster to handle incoming reads and writes, keep track ofstorage, and perform maintenance tasks such as compaction. You need to make surethat your cluster has enough nodes to satisfy the recommended limits for bothcompute and storage. Use themonitoring tools to checkwhether the cluster is overloaded.
- Compute - If your Bigtable cluster's CPUis overloaded, adding more nodes improves performance by spreading theworkload across more nodes.
- Storage - If yourstorage usage per node is higherthan recommended, then add more nodes to maintain optimal latency andthroughput, even if the cluster has enough CPU to process requests. This isbecause increasing the amount of storage per node increases the amount ofbackground maintenance work per node. For more information, seeTrade-offs between storage usage and performance.
The Bigtable cluster was scaled up or scaled down recently.After autoscaling increases the number of nodes in a cluster, it can take up to 20minutes under load before performance significantly improves.Bigtable scales cluster nodes based on the load they experience.
When you decrease the number of nodes in a cluster to scale down, try not toreduce the cluster size by more than 10% in a 10-minute period to minimizelatency spikes.
The Bigtable cluster uses HDD disks. In most cases, yourcluster should use SSD disks, which have significantly better performance thanHDD disks. SeeChoosing between SSD and HDD storage fordetails.
There are issues with the network connection. Network issues can reducethroughput and cause reads and writes to take longer than usual. In particular,you might see issues if your clients are not running in the samezone as your Bigtable cluster, or if your clients runoutside of Google Cloud.
You are using replication but your application is using an out-of-dateclient library. If you observe increased latency after enabling replication,make sure the Cloud Bigtable client library that your application is using isup to date. Earlier versions of the client libraries might not be optimized tosupport replication. SeeCloud Bigtable client libraries tofind your client library's GitHub repository, where you can check the versionand upgrade if you need to.
You enabled replication but didn't add more nodes to your clusters. In aninstance that uses replication, each cluster must handle the work of replicationin addition to the load it receives from applications. Underprovisionedclusters can cause increased latency. You can verify this by checking theinstance'sCPU usage charts in the Google Cloud console.
Because different workloads can cause performance to vary, perform tests withyour workloads to obtain the most accurate benchmarks.
Cold starts and low QPS
Cold starts and low QPS can increase latency. Bigtable performsbest with large tables that are frequently accessed. For this reason, if youstart sending requests after a period of no usage (a cold start), you mightobserve high latency while Bigtable reestablishes connections.Latency is also higher when QPS is low.
If your QPS is low, or if you know you will sometimes send requeststo a Bigtable table after a period of inactivity, try thefollowing strategies to keep your connection warm and prevent high latency.
- Send a low rate of artificial traffic to the table at all times.
- Configure the connection pool to help ensure that steady QPS keeps the pool active.
During periods of low QPS, the number of errors thatBigtable returns is more relevant than the percentage ofoperations that return an error.
Cold start at client initialization time.If you are using a version of the Cloud Bigtable client for Java that isearlier than version 2.18.0, you canenable channel refreshing. In later versions, channel refreshing isenabled by default. Channel refreshing does two things:
- When the client initializes, it prepares the channel before sending the first requests.
- The server disconnects long-lived connections every hour. Channel priming preemptively replaces expiring channels.
However, this doesn't keep the channel alive when there are periods of inactivity.
How Bigtable optimizes your data over time
To store the underlying data for each of your tables, Bigtableshards the data into multiple tablets, which can be moved between nodes in yourBigtable cluster. This storage method enablesBigtable to use two strategies for optimizing dataover time:
- Bigtable stores roughly the same amount of data on eachBigtable node.
- Bigtable distributes reads and writes equally acrossall Bigtable nodes.
Sometimes these strategies conflict. For example, if onetablet's rows are read extremely frequently, Bigtable might storethat tablet on its own node, even if this causes some nodes to store moredata than others.
As part of this process, Bigtable might split a tablet intotwo or more smaller tablets to reduce its size or to isolate hotrows within an existing tablet.
The following sections explain each of these strategies in more detail.
Distributing the amount of data across nodes
As you write data to a Bigtable table, Bigtableshards the table's data into tablets. Each tablet contains a contiguous range ofrows within the table.
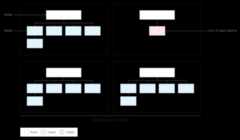
If you have written less than several GB of data to the table,Bigtable stores all tablets on a single node withinyour cluster:

As more tablets accumulate, Bigtable moves some toother nodes in the cluster to balance the amount of data more evenlyacross the cluster:

Distributing reads and writes evenly across nodes
If you'vedesigned your schema correctly, then reads and writesshould be distributed fairly evenly across your entire table. However, there aresome cases where you can't avoid accessing certain rows more frequently thanothers. Bigtable helps you deal with these cases by taking readsand writes into account when it balances tablets across nodes.
For example, suppose that 25% of reads go to a small number of tabletswithin a cluster, and reads are spread evenly across all other tablets:
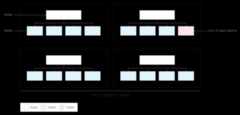
Bigtable will redistribute the existing tablets so that reads arespread as evenly as possible across the entire cluster:
Test performance with Bigtable
If you're running a performance test for an application that depends onBigtable, follow these guidelines as you plan and execute yourtest:
- Test with enough data.
- If the tables in your production instance contain a total of 100 GB of dataor less per node, test with a table of the same amount of data.
- If the tables contain more than 100 GB of data per node, test with atable containing at least 100 GB of data per node. For example, if yourproduction instance has one four-node cluster, and the tables in the instancecontain a total of 1 TB of data, run your test using a table of at least 400GB.
- Test with a single table.
- Stay below the recommended storage utilization per node. For details, seeStorage utilization per node.
- Before you test, run a heavy pre-test for several minutes. This stepallows Bigtable to balance data across your nodes based onthe access patterns it observes.
- Run your test for at least 10 minutes. This step letsBigtable further optimize your data, and it helps ensure that youwill test reads from disk as well as cached reads from memory.
Troubleshoot performance issues
If you think that Bigtable might be creating a performancebottleneck in your application, be sure to check all of the following:
- Examine the Key Visualizer scans for your table. TheKey Visualizer toolfor Bigtable generates new scan data every 15minutes showing the usage patterns for each table in a cluster. KeyVisualizer lets you check whether your usage patterns are causingundesirable results, such as hotspots on specific rows or excessive CPUutilization. For more information, seeUse Key Visualizer.
- Comment out the code that performs Bigtable reads andwrites. If the performance issue disappears, then you're probably usingBigtable in a way that results in suboptimal performance. If theperformance issue persists, the issue is probably not related toBigtable.
Ensure that you're creating as few clients as possible. Creating a clientfor Bigtable is a relatively expensive operation. Therefore, youshould create the smallest possible number of clients:
- If you usereplication, or if you useappprofiles to identify different types of traffic to yourinstance, create one client per app profile and share the clientsthroughout your application.
- If you don't use replication or app profiles, create a single clientand share it throughout your application.
If you're using the HBase client for Java, you create a
Connectionobjectrather than a client, so create as few connections as possible.Make sure you're reading and writing many different rows in your table.Bigtable performs best when reads and writes are evenlydistributed throughout your table, which helps Bigtable distributethe workload across all of the nodes in your cluster. If reads and writes cannotbe spread across all of your Bigtable nodes, performance willsuffer.
If you find that you're reading and writing only a small number of rows, youmight need toredesign your schema so that reads and writesare more evenly distributed.
Verify that you see approximately the same performance for reads andwrites. If you find that reads are much faster than writes, you might betrying to read row keys that don't exist, or a large range of row keys thatcontains only a small number of rows.
To make a valid comparison between reads and writes, aim for atleast 90% of your reads to return valid results. Also, if you're reading alarge range of row keys, measure performance based on the actual number ofrows in that range, rather than the maximum number of rows thatcouldexist.
Use the right type of write requests for your data.Choosing the optimal way towrite your data helps maintain highperformance.
Check the latency for a single row. If you observe unexpected latency whensending
ReadRowsrequests, you can check the latency of the first row of therequest to narrow down the cause. By default, the overall latency for aReadRowsrequest includes the latency for every row in the request as well asthe processing time between rows. If the overall latency is high but the firstrow latency is low, this suggests that the latency is caused by the number ofrequests or processing time, rather than by a problem withBigtable.If you're using the [Bigtable client library for Java][java-client], you can view the
read_rows_first_row_latencymetric in theGoogle Cloud console Metrics Explorerafterenabling client side metrics.Use a separate app profile for each workload. If you experienceperformance issues after adding a new workload,create a new app profile for the new workload. Then you can monitormetrics for your app profiles separately to troubleshoot further. SeeHow app profiles work for details on why it's a best practiceto use multiple app profiles.
Enable client-side metrics. You canset up client-side metrics to helpoptimize and troubleshoot performance issues. For example, sinceBigtable works best with evenly distributed, high QPS, increased P100(max) latency for a small percentage of requests does not necessarily indicate alarger performance issue with Bigtable. Client-side metrics cangive you insight into which portion of the request lifecycle might be causing latency.
Make sure your application consumes read requests before they time out. Ifyour application processes data during a read stream, you run the risk of therequest timing out before you've received all responses from the call. Thisresults in an
ABORTEDmessage. If you see this error, reduce the amount ofprocessing during the read stream.
What's next
- Learn how todesign a Bigtable schema.
- Find out how tomonitor Bigtable performance.
- Learn how totroubleshoot issues with KeyVisualizer.
- Learn how totroubleshoot latency.
- View sample code forprogrammatically adding nodes to aBigtable cluster.
Except as otherwise noted, the content of this page is licensed under theCreative Commons Attribution 4.0 License, and code samples are licensed under theApache 2.0 License. For details, see theGoogle Developers Site Policies. Java is a registered trademark of Oracle and/or its affiliates.
Last updated 2025-12-15 UTC.