
Monitoring and alerting latency
This page describes how to monitor and get alerts from elevated latency inGoogle App Engine.
High latency for App Engine apps can occur for various reasons. Forexample, the app does not have optimized code, there aren't enough resources,there are busy machines, and so forth. This guide focuses on the latencygenerated by App Engine regardless of the reason.
It is important to understand that high latency can often lead to 5xx errors.Therefore, rapid detection of high latency can help you act in time and thusresolve application errors.
Setting up Monitoring and Alerting
Monitoring
If you want to create a customized graph to monitor your app's response latency,useCloud Monitoring >Metrics Explorer to build your own graph.
In theResource Type, selectGAE Application and selectResponse latencyin theMetric filter. If you have a specific service to check, you can alsouseFilters to filter by the specific module to see the response latencychart.
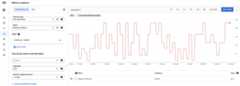
Now that you've set up your customized graph, let's take a look at the nextsection and learn how to set up notifications for latencies over a certainamount of seconds.
Alerting
To create an alerting policy, do the following:
- Set up notifications, create an alerting policy inCloud Monitoring >Alerting and click on+ CREATE POLICY.
Add a condition to your alert by clickingADD CONDITION.
Select GAE Application as a target:
For example, if you wanted to get alerts for response latency, such as how longyour App Engine app is taking to respond, select response latency.
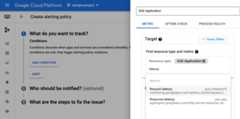
You can also select the module ID if it's appropriate, and add a threshold and anotification channel. SeeManaging notification channelsfor instructions.
After you have finished creating the policy, you will see the policy in a listin the Alerting page. Click on the created policy to see the details, as shownin the following image:
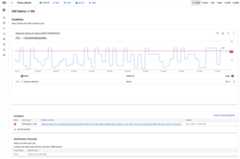
Congratulations, you just created your first App Engine latency policy!After you create your policy, the app will send an alert to the selected channelif it detects an incident.
Debugging latency
Checking the App Engine latency dashboard
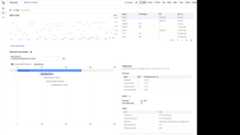
In general, when you want to see the latency of App Engine applications,go toApp Engine >Dashboard and select theLatency graph.
In the latency graph, you can drill into the data by filtering the graphs byservice, version, and interval.

In the previous image, notice how the application latency varies from a fewmilliseconds to almost 25s.
Understanding app latency
To understand now how long a particular request has taken, go to:
- Cloud Logging to view request logs and application logs.
- Cloud Trace to track how requests propagate.
Cloud Logging
In Cloud Logging you can find two categories of logs, request logs andapplication logs. Request logs are automatically written by App Enginefor each request to your application and contains the HTTP method, responsecode, and so forth. Application logs are those that you write for yourapplication.
To view request logs or application logs, seeViewing logs.
Cloud Trace
Cloud Trace is useful for understanding how requests propagate through yourapplication. You can inspect detailed latency information for a single requestor view aggregate latency for your entire application.
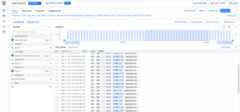
To view trace details in Cloud Trace, you can followFind and explore traces.In theTrace explorer, as shown in the followingimage, you can use the filters to filter by your specific App Engineservice and version.
Except as otherwise noted, the content of this page is licensed under theCreative Commons Attribution 4.0 License, and code samples are licensed under theApache 2.0 License. For details, see theGoogle Developers Site Policies. Java is a registered trademark of Oracle and/or its affiliates.
Last updated 2025-12-15 UTC.