
Write and view logs
This page describes the logs that are available for App Engine apps, andhow to write, correlate, and view log entries.
App Engine collects two types of logs:
Request log: Logs of requests sent to your app. By default, App Engineautomatically emits a log entry for each HTTP request an app receives.
App log: Log entries that are emitted by an App Engine appbased on the log entries you write to a supported framework or file.
App Engine automatically sends both the request logs and app logs to theCloud Logging agent.
Write app logs
App Engine automatically emits logs for requests sent to your app, sothere is no need to write request logs. This section covers how to write app logs.
When you write app logs from your App Engine app, the logs are picked upautomatically by Cloud Logging, as long as the logs are written using thefollowing methods:
Integrate with Cloud Logging
You can integrate your App Engine app with Cloud Logging.This approach lets you use all the features offered by Cloud Logging and requiresonly a few lines of Google-specific code.
You can write logs to Cloud Logging from Python applications by using the standardPython logging handler, or by using the Cloud Logging API client library for Python directly.When you use the standard Python logging handler, you must attach a Cloud Logginghandler to the Python root handler. For more information, seeSetting up Cloud Logging for Python.
Important: The Logs Explorer does not display an app log entry that exceeds16 kilobytes.Write structured logs tostdout andstderr
By default, App Engine uses the Cloud Logging client library to send logs.However, this method doesn't support structured logging. You can only writestructured logs usingstdout/stderr. Additionally, you can also send text strings tostdout andstderr. By default, the log payload is atext string stored in thetextPayload field of the log entry. The stringsappear as messages in the Logs Explorer, the command line, and theCloud Logging API, and are associated with the App Engine serviceand version that emitted them.
To get more value from the logs, you can filter these strings in the Logs Explorerby severity level. To filter these strings, you need to format the strings asstructured data.To do this, you write logs in the form of a singleline of serialized JSON. App Engine picks up and parses this serialized JSON line,and places it into thejsonPayload field of the log entry instead oftextPayload.
The following snippets demonstrate writing such structured logs.
Note: These snippets were originally written forCloud Run.They are equally applicable to App Engine.# Uncomment and populate this variable in your code:# PROJECT = 'The project ID of your Cloud Run service';# Build structured log messages as an object.global_log_fields={}# Add log correlation to nest all log messages.# This is only relevant in HTTP-based contexts, and is ignored elsewhere.# (In particular, non-HTTP-based Cloud Functions.)request_is_defined="request"inglobals()or"request"inlocals()ifrequest_is_definedandrequest:trace_header=request.headers.get("X-Cloud-Trace-Context")iftrace_headerandPROJECT:trace=trace_header.split("/")global_log_fields["logging.googleapis.com/trace"]=f"projects/{PROJECT}/traces/{trace[0]}"# Complete a structured log entry.entry=dict(severity="NOTICE",message="This is the default display field.",# Log viewer accesses 'component' as jsonPayload.component'.component="arbitrary-property",**global_log_fields,)print(json.dumps(entry))In the App Engine standard environment, writing structured logs tostdout andstderrdon't count against the log ingestion requests per minute quota in the Cloud Logging API.
Special JSON fields in messages
When you provide a structured log as a JSON dictionary, some special fields arestripped from thejsonPayload and are written to the corresponding field inthe generatedLogEntry as described inthe documentation forspecial fields.
For example, if your JSON includes aseverity property, it is removed fromthejsonPayload and appears instead as the log entry'sseverity.Themessage property is used as the main display text of the log entry if present.
Correlate request logs with app logs
After you'veformatted the entries as a JSON object and providedspecific metadata, you can enable filtering and correlation with request logs.To correlate the request log entries with the app log entries, you need the request'strace identifier. Follow the instructions to correlate log messages:
- Extract the trace identifier from the
X-Cloud-Trace-Contextrequest header. - In your structured log entry, write the ID to a field named
logging.googleapis.com/trace.For more information about theX-Cloud-Trace-Contextheader,seeForcing a request to be traced.
To view correlated logs, seeView correlated log entries in the Logs Explorer.
View logs
You can view app logs and request logs in several ways:
- Use Logs Explorer from Cloud Logging in the Google Cloud console.
- Use the Google Cloud CLI to view logs using gcloud.
- Read logs programmatically using various methods.
Use Logs Explorer
You can view your app and request logs using theLogs Explorer:
Go toLogs Explorer in the Google Cloud console:
Select an existing Google Cloud project at the top of the page.
InResource Type, selectGAE Application.
You can filter the Logs Explorer by App Engine service, version andother criteria. You can also search the logs for specific entries.SeeUsing the Logs Explorerfor details.
If you send simple text entries to standard output, you cannot use the LogsViewer to filter app entries by severity, nor can you see which app logscorrespond to specific requests. You can still use other types of filteringin the Logs Explorer, such as text and timestamp.
View correlated log entries in the Logs Explorer
In the Logs Explorer, to view the child log entries correlated with a parentlog entry, expand the log entry.
For example, to display your App Engine request log entry and application logentries, do the following:
In the navigation panel of the Google Cloud console, selectLogging, and then selectLogs Explorer:
InResource Type, selectGAE Application.
To view and correlate request logs, inLog Name, selectrequest_log. Alternatively,to correlate by request logs, clickCorrelate by and selectrequest_log.
In theQuery results pane, to expand a log entry,clickExpand. On expanding, each request logwill show the associated app logs.
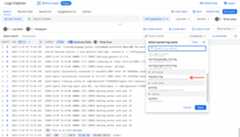
After creating a filter for the logs, each request log shows correspondingapp logs as child logs. Logs Explorer achieves this by correlatingthetrace field in app logs and a given request log, assuming the applicationuses thegoogle-cloud-logging library.
The following image shows app logs grouped by thetrace field:

Use the Google Cloud CLI
To view your App Engine logs from the command line, use thefollowing command:
gcloudapplogstail
For more information, seegcloud app logs tail.
Reading logs programmatically
If you want to read the logs programmatically, you can use one of these methods:
- Use alog sink to Pub/Sub and a script to pull from Pub/Sub.
- Call the Cloud Logging API through theclient library foryour programming language.
- Call theCloud Logging API REST endpoints directly.
Pricing, quotas, and logs retention policy
For information about pricing that applies to both request and app logs, seePricing for Cloud Logging.
For the logs retention policy and the maximum size of log entries, seeQuotasand limits. If you want to store your logs for a longerperiod, you canexport your logs to Cloud Storage.You can also export your logs to BigQuery and Pub/Sub forfurther processing.
Managing log resource usage
You can control the amount of logging activity from your app logs by writingmore or fewer entries from your app's code. Request logs are createdautomatically, so to manage the number of request log entries associated withyour app, Use thelogs exclusion featurefrom Cloud Logging.
Known issues
The following are some logging issues in the second-generation runtimes:
Sometimes app log entries are not correlated with the request log. Thishappens the first time your app receives a request and any other timeApp Engine writes status messages to your app's log. For moreinformation, seehttps://issuetracker.google.com/issues/138365527.
When you route logs from log sink to Cloud Storage, the Cloud Storagedestination only contains request logs. App Engine writes app logs todifferent folders.
BigQuery fails to ingest logs due to the
@typefield in request logs. Thisdisrupts the auto-schema detection, since BigQuery doesn't allow@typein fieldnames. To resolve this, you must manually define the schema, and remove the@typefield from request logs.If you use the logging REST APIs, a background thread writes logs to Cloud Logging.If the main thread isn't active, the instance doesn't get CPU time, which causesthe background thread to stop. Log processing time is delayed. Atsome point, the instance is removed and any unsent logs are lost. To avoid losing logs, use one of the following options:
- Configure the Cloud Logging SDK to use gRPC. With gRPC, the logs are sent toCloud Logging immediately. However this can increase the required CPU limits.
- Send log messages to Cloud Logging using
stdout/stderr. This pipeline isoutside the App Engine instance and doesn't get throttled.
What's next
- SeeMonitor and alert latencyto learn how to use Cloud Logging to view logs for debugging errors, andhow to use Cloud Trace to understand app latency.
Except as otherwise noted, the content of this page is licensed under theCreative Commons Attribution 4.0 License, and code samples are licensed under theApache 2.0 License. For details, see theGoogle Developers Site Policies. Java is a registered trademark of Oracle and/or its affiliates.
Last updated 2025-12-15 UTC.