

Security reports
This pageapplies toApigee andApigee hybrid.
View Apigee Edge documentation.
TheSecurity Reports view lets you create reports to identify security threats to your APIs. To generate reports, Apigee scans API traffic data over a specified time interval and searches for unusual traffic patterns that could be caused by malicious agents. Apigee then displays a report showing all suspicious activity. Using this information, you can then take action to block attacks against your APIs.
You can create security reports either in the Apigee UI, as described below, or using theSecurity reports API. If you use the UI, the data for reports is restricted to the environment you choose. However, using the API, you can also create reports for environment groups.
See Required roles for security reports for the roles needed to perform security reports tasks.
To use this feature, you must enable the add-on. If you are a Subscription customer, you can enable the add-on for your organization. See Manage Advanced API Security for Subscription organizations for more details. If you are a Pay-as-you-go customer, you can enable the add-on in your eligible environments. For more information, see Manage the Advanced API Security add-on.
Note: If you add an environment after enabling Advanced API Security, you will need to re-enable it, by running the command shown inEnable Advanced API Security again, to view security reports for the new environment.Bot detection
One of the most serious threats to API security comes frombots: automatedscripts that send malicious requests to APIs. Advanced API Security searches forspecific API traffic patterns, calleddetection rules,which are based on analysis of real API data, to detect bots.
Security reports data delay
Data flowing into the Apigee Analytics pipeline has a delay of up to 15 to 20 minutes on average. As a result, a security report in which the end time is less than 20 minutes in the past might return incorrect results.
Open theSecurity reports view
To open theSecurity reports view:
In the Google Cloud console, go to theAdvanced API security> Security reports page.
This displays the mainSecurity reports view:

At the top of the page, you can select:
- The environment in which you want to create a report.
- TheReport type filter. The options are:
- All
- Active
- Failed
- Expired
Below those options, the security reports are displayed in the rows of a table. Each row displays the following report details:
- TheReport Name. Click the report name to view the report.
- The reportStatus, which can be one of the following:
- running: The report is currently running and cannot be viewed yet.
- completed: The report is completed and can be viewed or exported.
- expired: The report has expired and can no longer be viewed or exported in the UI. To view a report after the expiration date, you must export it before that date. After 30 days, the report is removed from the list of available reports.
TheStart time andEnd time display the start and end dates and times for the report.
- Submitted date: The date and time the request for the report was submitted.
- Expiration time: The date and time when the report expires and can no longer be viewed in the Apigee UI. The expiration date is 7 days after the time when you created the report. After 30 days, the report is removed from the list of available reports. You cannot view or export reports in the UI after their expiration date.
- File size: The report file size. You might need to modify the report criteria in order to create a report with a file size below the maximum file size. SeeLimitations on security reports for information on the maximum file size and specific ways to reduce the file size.
- Export: Exports/downloads the report in a zip file. Export is only available if the status of the report iscompleted.
Create a new security report
To create a new security report, start by clicking+Create in theSecurity reports view. This opens theCreate Security Report Job dialog, where you can configure the options for the report as described in the next section.
Security report options
You can specify the following options for a security report:
- Report Name: A name for the report.
- Report Date Range: Start time and end time for the report.
Note: The start and end times of the report must be in the past, and at most one year in the past when the report is created.
- Metrics: Metric for the report. You can choose from the following metrics and aggregation functions—functions that compute statistics for the metrics.
Metric Description Aggregation functions bot The number of distinct IP addresses for detected bots over one-minute intervals. count_distinct bot_traffic The number of messages from IP addresses of detected bots over one-minute intervals. sum message_count Total number of API calls processed by Apigee in one-minute intervals.
Note:message_count cannot be used with other metrics, or with thebot_reason dimension, in the same report.
sum response_size Size of the response payload returned in bytes. sum,avg,min,max Dimensions: Dimensions let you group metric values together based on related subsets of the data. The following table describes the dimensions that are specific to Advanced API Security reports.
Dimension Description bot_reasonincident_id(preview)security_action(preview)The type security action. Possibly values are ALLOW, DENY, and FLAG. security_action_nameThe name of the security action. security_action_headersHeaders attached to a request for an ALLOW action. Note: The dimensionbot_reason, which is specific to Advanced API Security, can be any combination of the individualdetection rules. When a bot is detected,bot_reason consists of the subset of the individual detection rules that the bot's traffic matched when it was detected.
Note:bot_reason andincident_id only work with the following metrics:
- bot
- bot_traffic
- response_size
Seedimensions for other dimensions supported by Advanced API Security reports.
To add multiple dimensions, just click+Add a Dimension for each dimension you want to add. You can also change the order in which dimensions appear in the report by clicking the up or down arrows to the right of the dimension field.
Note: The order of dimensions doesnot affect the numerical values shown in the report—only the order in which dimensions are presented in the report.- Filters: Filters let you restrict results to metrics with specific values.Important: Security report jobs that filter on the
incident_idmust include theincident_idas a dimension. To create a filter, set the following fields:- Select a name for the filter.
- Select a comparison operator.
- Select a value.
SeeFilters.
After you have selected all the report options, clickCreate to create the report job. You might need to wait for a while until the report is completed. You can click theRefresh button at the top right of the pane to see the completed report.
View a completed report
Once a report is completed, it is displayed in the table as shown below:
To view the report, either:
- Click the report name.
- ClickExport in the row for that report.
Example: bot IP addresses report
The following example creates a report that shows the IP addresses of detected bots.To create the report, use the following configuration:
- Metric:bot, the number of distinct IP addresses identified as sources of bots.
- Aggregation function:count_distinct
- Dimension:Resolved Client IP
The completed report is shown below:

Note that the table at the bottom of the report lists IP addresses that Advanced API Securityhas identified as bots.
Example: bot traffic by bot reason report
The next example creates a report of bot traffic—the number of requests from IP addressesthat have been identified as the sources of bots—bybot_reason—the set ofdetection rules that led to the bot being detected. To create the report,use the following configuration:
- Metric:bot_traffic
- Aggregation function:sum
- Dimension:bot_reason
The completed report is shown below:
Eachbot_reason consists of a subset of the individualdetection rules.As you can see in the graph, The detection rulethat contributed to thelargest amount of bot traffic is the following set of rules:
- Flooder
- Brute Guessor
- Robot Abuser
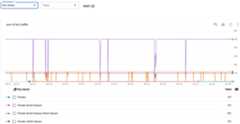
Example: bot traffic report
The next example creates a report that isn't grouped by a dimension.If you don't want to group data by a dimension, you can setDimension toenvironment.Since data is always restricted to the selected environment, this results in a report that hasno grouping of data.
- Metric:bot traffic
- Aggregation function:sum
- Dimension:environment

The report displays the total traffic from IP addresses that have been identified as sources of bots, for each one-minute interval throughout the report time range. Note that there is no grouping.
More examples of security reports
The follow table lists some examples of security of reports that you can create using differentmetrics and dimensions:
| Report | Metrics | Dimensions |
|---|---|---|
| All Bot Traffic & Bot Count Report for per environment | bot,bot_traffic | environment |
| Bot Traffic & Bot Count Report for different bot reasons | bot,bot_traffic | bot_reason |
| Bot Traffic & Bot Count Report for different Countries | bot,bot_traffic | ax_geo_country |
| Bot Traffic & Bot Count Report for different ISPs | bot,bot_traffic | ax_isp |
| Bot Detection Report (Detailed List View) | bot_traffic | Resolved Client IP,ax_isp,bot_reason,request_uri,client_id |
| Bot traffic per Access Token | bot_traffic | access_token |
| Bot traffic per API proxy | bot_traffic | apiproxy |
| Bot traffic per Agent Family | bot_traffic | ax_ua_agent_family |
| Bot traffic per User Agent | bot_traffic | useragent |
| Bot traffic per Agent Type | bot_traffic | ax_ua_agent_type |
| Bot traffic per Device Category | bot_traffic | ax_ua_device_category |
| Bot traffic per OS family | bot_traffic | ax_ua_os_family |
| Bot traffic per Client ID | bot_traffic | client_id |
| Bot traffic per Proxy Basepath | bot_traffic | proxy_basepath |
| Bot traffic per Proxy Path Suffix | bot_traffic | proxy_pathsuffix |
| Bot traffic per Request URI | bot_traffic | request_uri |
| Bot traffic per Request Verb | bot_traffic | request_verb |
| Bot traffic per Response Status Code | bot_traffic | response_status_code |
Limitations on security reports
Security reports have the following limitations:
- Data flowing into the Apigee Analytics pipeline has a delay of up to 15 to 20 minutes on average. As a result, creating a report in which theEnd Time is less than 20 mins in the past might return incorrect results.
- Maximum time range for bot reports is 1 year.
- The maximum number of metrics you can use in a report is 25, and the maximum number of dimensions you can use is 25.
- As with theasynchronous custom reports API, there is a limit of 31 MB of data for a report. If you encounter a size limit on a report, you can either:
- Reduce the time range of the report.
- Split the data into smaller subsets by filtering on a set of values, and then create multiple reports, one for each subset.
- TheResolved Client IP dimension can't be listed in the same report with either theax_geo_city orax_geo_country dimension, due to privacy concerns.
- Security report jobs that filter on the
incident_idmust include theincident_idas a dimension. - The following metrics are only available via theSecurity Reports API, but not in the UI:bot_first_detected (min) andbot_last_detected (max).
Except as otherwise noted, the content of this page is licensed under theCreative Commons Attribution 4.0 License, and code samples are licensed under theApache 2.0 License. For details, see theGoogle Developers Site Policies. Java is a registered trademark of Oracle and/or its affiliates.
Last updated 2025-12-17 UTC.