Using Offline Debug

This pageapplies toApigee andApigee hybrid.

View Apigee Edge documentation.

The Offline Debug tool lets you view and analyze "offline" debug sessions that werepreviously downloaded in theDebug view in the Proxy Editor. A saved debug session is essentially a "recording" of a debug session, and can be useful for cases where troubleshooting and further analysis is required. The UI for the Offline Debug tool is similar to theDebug view in the Proxy Editor.

To learn about the Debug Tool UI and on downloading debug sessions, seeUsing Debug.

Note: The Debug Tool is available in the Apigee UI and some debug actions can be performed using the API. The Apigee UI options are Debug v2 (new) and Debug v1 (released07/01/2022). You can switch between versions of the Debug Tool in the Apigee UI; however, Debug v1 will be shutdown on January 15, 2026.

Debug v2 (new)

To view downloaded debug data using Offline Debug:

  1. In the Google Cloud console, go to theProxy development> Offline Debug page.

    Go to Offline Debug

  2. TheOffline Debug view displays:

    Click to view larger image
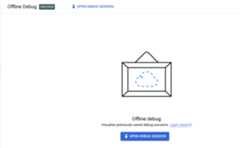
  3. To load data into theOffline Debug view, clickOpen Debug Session, select a previously downloaded offline debug session file in JSON format, and then clickOpen.

    Note: When you download a debug session in the Proxy EditorDebug view, the name of the download file has the formdebug-{session ID}.json, where{session id} is the ID of the debug session; however, you can rename the file if you wish.

    The Apigee UI loads the debug file's data and displays all of the transactions in the list in theTransactions panel.

    Click to view larger imageOffline                Offline Debug view with debug file loaded
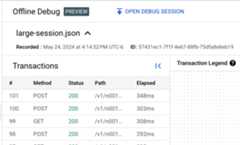
  4. Click the row for the transaction in theTransactions panel to display the transaction in theTransaction Map.Click to view larger imageDownloaded transaction map

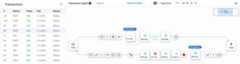
From here, you can explore the debug session just as you would for a newly-created debug session. See Creating a debug session for more information.

Debug v1

Important: Debug v1 will be shutdown on January 15, 2026. Use Debug v2 instead of Debug v1.

To view downloaded debug data using Offline Debug:

  1. Sign in to theGoogle Cloud console.
  2. SelectAPI Proxies from the main view.
  3. SelectDevelop > Offline Debug.

    TheOffline Debug view displays:

    Offline            Offline Debug view in new Proxy Editor

  4. To load data into theOffline Debug view, click theOpen Debug Session button and select apreviously downloaded offline debug session file in JSON format.

    Note: When you download a debug session in the Proxy EditorDebug view, the name of the download file has the form 'debug-{session ID}.json', where {session id} is the ID of the debug session. However, you can rename the file if you wish.

    The Apigee UI loads the debug file's data and displays a new row for the transaction in the left-hand panel.

    Offline            Offline Debug view with debug file loaded.

  5. Click the row for the transaction in the left-hand panel to display a Gantt chart of the transaction in a Gantt chart.

    Gantt chart of transaction steps in right-hand pane.

From here, you can explore the debug session just as you would in theDebug view in the new Proxy Editor. See the section "Viewing the Gantt chart for a request and response."

Except as otherwise noted, the content of this page is licensed under theCreative Commons Attribution 4.0 License, and code samples are licensed under theApache 2.0 License. For details, see theGoogle Developers Site Policies. Java is a registered trademark of Oracle and/or its affiliates.

Last updated 2025-12-17 UTC.