

About anomaly detection
This pageapplies toApigee andApigee hybrid.
View Apigee Edge documentation.
What is an anomaly?
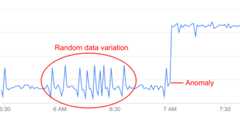
Ananomaly is an unusual or unexpected API data pattern. For example, take a look at the graph of API error rate below:
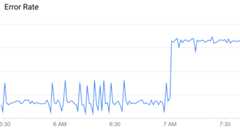
As you can see, the error rate suddenly jumps up at around 7 AM. Comparedto the data leading up to that time, this increase is unusual enough to be classified as an anomaly.
However, not all variations in API data represent anomalies: mostare simply random fluctuations. For example, you can see some relatively minor variations in error rate leading up to the anomaly, but these are not significant enough to be called a true anomaly.
AAPI Ops continually monitors API data and performs statistical analysis to distinguish trueanomalies from random fluctuations in the data.
Without anomaly detection, you need to choose athreshold for detecting eachanomaly yourself. (A threshold is a value that a quantity, such as error rate, must reach to triggeran anomaly.) You also need to keep the threshold values up to date, based on the latest data.By contrast, AAPI-Ops chooses the best anomaly thresholds for you, based on recentdata patterns.
When AAPI detects an anomaly like the one shown above, it displays the anomaly details in theAnomaly Events dashboard.At this point, you can investigate the anomaly in the API Monitoring dashboards andtake appropriate action if necessary. You can alsocreate an alert to notify you if similar events occur in future.
A detected anomaly includes the following information:
- The metric that caused the anomaly, such as proxy latency or an HTTP error code.
- The severity of the anomaly. The severity can be slight, moderate, or severe, based on its confidence level in the model. A low confidence level indicates that the severity is slight, while a high confidence level indicates that it is severe.
Anomaly types
Apigee automatically detects the following types of anomalies:
- Increase in HTTP 503 errors at the organization, environment, and region level
- Increase in HTTP 504 errors at the organization, environment, and region level
- Increase in all HTTP 4xx or 5xx errors at the organization, environment, and region level
- Increase in the total response latency for the 90th percentile (p90) at the organization, environment, and region level
How anomaly detection works
Anomaly detection involves the following stages:
Train models
Anomaly detection works by training a model of the behavior of your API proxies from historicaltime-series data. There is no action required on your part to train the model. Apigee automaticallycreates and trains models for you from the previous six hours of API data.Therefore, Apigee requires a minimum of six hours of data on an API proxy to train the model beforeit can log an anomaly.
The goal of training is to improve the accuracy of the model, which can then be testedon historical data. The simplestway to test a model's accuracy is to calculate itserror rate—thesum of false positives and false negatives, divided by the total number of predicted events.
Log anomaly events
At runtime, Apigee anomaly detection compares the current behavior of your API proxies with the behaviorpredicted by the model. Anomaly detection can then determine, with a specific confidence level,when an operational metric is exceeding the predicted value. For example, when the rate of 5xx errorsexceeds the rate predicted by the model.
When Apigee detects an anomaly, it automatically logs the event in theAnomaly Eventsdashboard. The list of events displayed in the dashboard includes alldetected anomalies, as well as triggered alerts.
Except as otherwise noted, the content of this page is licensed under theCreative Commons Attribution 4.0 License, and code samples are licensed under theApache 2.0 License. For details, see theGoogle Developers Site Policies. Java is a registered trademark of Oracle and/or its affiliates.
Last updated 2025-12-17 UTC.