td: R Access to twelvedata


Motivation
twelvedata provides a veryrich REST API, see thedocumentation. While a (free)login and a (free, permitting limited but possibly sufficient use) APIkey are required, the provided access is rich to set up simple Rroutines. This package does that.
Example
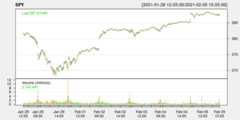
Here we are running (some) code from shown inexample(time_series)
>library(td)> data<-time_series("SPY","5min",outputsize=500,as="xts")>if (requireNamespace("quantmod",quietly=TRUE)) {>suppressMessages(library(quantmod))# suppress some noise>chartSeries(data,name=attr(data,"symbol"),theme="white")# convenient plot for OHLCV> }retrieves anxts object (providedxts is installed) andproduces a chart like this:
The package can also be used without attaching it. The next exampleretrieves twenty years of weekly CAD/USD foreign exchange data using adirecttd::time_series() call with having the packageloaded. The API key is automagically set (if it is in fact providedeither in the user config file or as an environment variable). Alsoshown by callingstr() on the return object is the metadataattach after each request:
> cadusd<- td::time_series(sym="CAD/USD",interval="1week",outputsize=52.25*20,as="xts")>str(cadusd)An ‘xts’ object on2001-02-27/2021-02-01 containing: Data: num [1:1045,1:4]0.6510.6460.6440.6380.642 ...-attr(*,"dimnames")=List of2 ..$:NULL ..$: chr [1:4]"open""high""low""close" Indexed by objects of class: [Date] TZ: UTC xts Attributes:List of6$ symbol: chr"CAD/USD"$ interval: chr"1week"$ currency_base: chr"Canadian Dollar"$ currency_quote: chr"US Dollar"$ type: chr"Physical Currency"$ accessed: chr"2021-02-06 15:16:29.209635">As before, it can be plotted using a function from packagequantmod; thistime we use the newerchart_Series():
> quantmod::chart_Series(cadusd,name=attr(data,"symbol"))
As the returned is a the very common and well-understood [xts]format, many other plotting functions can be used as-is. Here is anexample also showing how historical data can be accessed. We retrieveminute-resolution data forGME during the late January /early February period:
> gme<-time_series("GME","1min",+start_date="2021-01-25 09:30:00",+end_date="2021-02-04 16:00:00",as="xts")Note the use of exchange timestamps (NYSE is open from 9:30 to 16:00local time).
We can plot this again usingquantmod::chart_Series()showing how to display ticker symbol and exchange as a header:
> quantmod::chart_Series(gme,name=paste0(attr(gme,"symbol"),"/",attr(gme,"exchange")))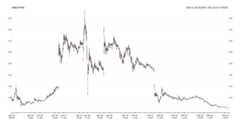
Naturally, other plotting functions and packages can be used. Here weuse thesame dataset but efficiently subset using a keyxts feature and fed into CRAN packagertsplot andrequesting OHLC instead of line plot.
> rtsplot::rtsplot(gme["20210128"],main="GME on 2021-Jan-28",type="ohlc")
Status
Still fairly new and fresh.
We also note that the package is not affiliated withtwelvedata. For an officiallysupported package, see theirtwelvedata-pythonpackage.
Contributing
Any problems, bug reports, or features requests for the package canbe submitted and handled most conveniently asGithub issues inthe repository.
Before submitting pull requests, it is frequently preferable to firstdiscuss need and scope in such an issue ticket. See the fileContributing.md(in theRcpp repo) for abrief discussion.
Author
Dirk Eddelbuettel
License
GPL (>= 2)
Initially created: Thu Feb 11 07:27:42 CST 2021
Last modified: Sun May 26 10:29:04 CDT 2024