Google Maps Platform Reporting

AI-generated Key Takeaways
Google Maps Platform provides various reports including Usage, Quota, Billing, and Engagement reports to monitor API usage, cost, and user engagement.
Reports are accessible via the Google Cloud Console, including the APIs & Services Dashboard and Google Maps Platform APIs & Services pages.
API usage is tracked through requests, with quota limits to prevent overages, and billing reports detailing costs based on usage.
Business Insights is an experimental feature providing anonymized data on user interactions, like map views and POI interactions, for understanding user engagement.
Key concepts include credentials, response codes, and the
solution_channelparameter, which are essential for understanding report data and customizing tracking.
Reporting in the Google Maps Platform provides a set of predefined visualreports of basic API usage, quota, and billing information in theGoogle Cloud console. Use these reports to determine the number of API callsyou've made, how close you are to hitting API usage quotas, and monitor yourbilling usage over time.
The types of reports include:
- Usage reports: Reports the number of requests your project makes to theGoogle Maps Platform APIs using credentials associated with your project.
- Quota reports: Reports quota usage in graphs that can be grouped inrequests per minute. The current quota limits for selected APIs aredisplayed in tables below the quota usage graphs.
- Billing reports: Reports costs over time as a stacked line chart. Viewthe current month's quota usage, inclusive of any usage-specific creditsapplied, as well as the total forecasted cost for the entire current month.
- Engagement reports: Provide business insightsabout how users engage with your map apps.
For a complete list of the response statuses and response codes that definewhether a request appears in theUsage,Quota, andBilling reports,seeResponse status and reports.
View the reports of Google Maps Platform usage, quota, and billing using theCloud console.
Usage reports
Usage is based on the number of requests your project makes to theGoogle Maps Platform APIs using the credentials associated with your project.Requests include successful requests, requests that result in server errors, andrequests that result in client errors. Credentials include API keys and clientIDs (for Premium Plan and migrated Premium Plan projects). For details, see thePremium Plan Overview and information on using aclient ID.
Usage metrics are displayed in tables (Requests, Errors, and Latency) and graphs(Traffic, Errors, and Latency). For tracking purposes:
All APIs: You can filter and group usage metrics for all APIs in theseways:
- Filter by time period and API.
- See traffic, error, and latency grouped by response code, API, andcredential.
A specific API: You can filter and group usage metrics for a specificAPI in these ways:
- Filter by time period, API versions, credentials, and methods.
- See traffic, error and latency grouped by response code, API method andversion, and credential.
APIs & Services Dashboard page
The APIs & ServicesDashboard provides an overviewof the usage metrics for all APIs enabled for your project: theGoogle Maps Platform APIs as well as other APIs and services.
TheDashboard page features three graphs and a table. You can filter theusage displayed in the graphs and tables by selecting a time period from 1hour up to the last 30 days.
TheTraffic graph shows usage in queries per minute (QPM) per API.
TheErrors graph shows percentage of the requests that resulted inerrors per API.
TheLatency graph shows the median latency of the requests per API.
Beneath the graphs, a table lists the enabled APIs and services. Requests arethe number of requests (for the selected time period). Errors are the number ofthese requests that resulted in errors. Latency (medium latency and percentile)is the latency for these requests.

To access the APIs & Services Dashboard page:
- Open the Project selector page in the Cloud console:
- Select your project. The APIs & Services Dashboard page appears.
If the page does not appear, select the menu button and then selectAPIs & Services.
For more information, seeMonitoring your API Usage.
Google Maps Overview page
The Google MapsOverview page includes a table listingenabled APIs and usage requests for the last 30 days. Requests by API are alsoshown in graph form. A billing graph shows your current bill and total usage forthe last 3 months.
Note:If you select the name of anyenabled API, you are directed to the Google MapsMetrics page for that API.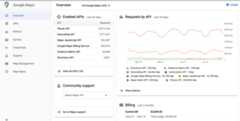
To access Google Maps Platform Overview page:
- Open the Google Maps Platform page in the Cloud console:
- In the left menu, selectOverview.
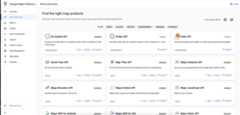
Google Maps Platform APIs & Services page
The Google MapsAPIs & Services page contains a gridof tiles representing the APIs, SDKs, and other services available to yourproject. Within each tile, you can enable or disable that service by selectingEnable orDisable, and you can access credentials information,metrics, and user guides for enabled APIs. Youcan also use the page filters to view enabled or disabled services and otherservice categories.
To access Google Maps Platform APIs & Services page:
- Open the Google Maps Platform page in the Cloud console:
- In the left menu, selectAPIs & Services.
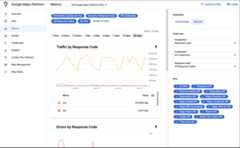
Google Maps Metrics page
The Google MapsMetrics page displays three graphs:Traffic, Errors, and Median Latency. The usage data in the graphs can be groupedby Response Code class, API, API method, Credential, Platform, and Domain.
Beneath the graphs, theMetrics page includes an APIs table that showsrequests, errors, and latency for the APIs you have selected.
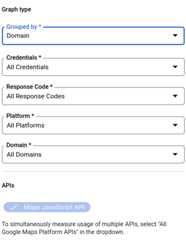
Using the API drop-down at the top, and the grouping and filtering options inthe right pane, you can group and filter displayed usage metrics by selectingspecific or multiple APIs, Credentials, Response Code classes, Platform type andDomain. You can also select a time period (from one hour up to the last 30 days)and granularity (per second or day) for the displayed usage metrics.
The following images showPlatform andDomain filters for a specific APIwhen grouping byPlatform andDomain is selected in theGrouped bydrop-down list:

To access Google Maps Platform API Metrics page:
- Open the Google Maps Platform page in the Cloud console:
- In the left menu, selectMetrics.
Credential reporting
You can filter and group metrics by the credential that was used to load theAPI.
| Credential format | Meaning |
|---|---|
| Key name For example, "Mobile app key" | An API key was used to load the API using?key=...: You can find the key names on the Maps Platform Console underKeys & Credentials. |
| Project Number For example, "project_number:123456", where 123456 is your project number. | There are two possibilities if you see this credential:
|
Response code graphs
TheTraffic by response code andError by response code graphs splitusage by HTTP response code class. This table shows the mapping between theGoogle Maps Platform API response status and HTTP response code class:
| Maps API status | HTTP response code class - Usage report (2xx, 3xx, 4xx, 5xx) | Notes |
|---|---|---|
| OK | 2xx | Successful response. This is a billable request and will consume quota. |
| OK | 3xx | Successful response. This is a billable request and will consume quota. For example, thePlace Photo successful requests return 302 redirect to the referenced image. |
| DATA_NOT_AVAILABLE | 4xx(1) | Successful response indicating that there's no available data for the input locations. This is a billable request and will consume quota. |
| ZERO_RESULTS | 4xx(1) | Successful response returned no result. This is a billable request and will consume quota. |
| NOT_FOUND | 4xx(1) | For theDirections API (Legacy), this message indicates that at least one of the locations specified in the request's origin, destination, or waypoints couldn't be geocoded. For thePlaces API this message indicates that the referenced location (place_id) was not found in the Places database. This is a billable request and will consume quota. |
| INVALID_REQUEST (invalid parameter value), MAX_WAYPOINTS_EXCEEDED, MAX_ROUTE_LENGTH_EXCEEDED, and others. | 4xx | Error caused by invalid parameter value. Check the API response for more details. This is a billable request and will consume quota. |
| REQUEST_DENIED | 4xx | Client error caused by authentication error, access error, and others. Check the API response for more details. |
| OVER_DAILY_LIMIT, OVER_QUERY_LIMIT, RESOURCE_EXHAUSTED, rateLimitExceeded, dailyLimitExceeded, userRateLimitExceeded | 4xx | Client error caused by too many requests per allowed time period. Retry the request at a later time. Check the API response for more details. |
| INVALID_REQUEST (invalid or missing parameter, request parsing or validation error) | 4xx | Client error caused by invalid request. Check the API response for more details. |
| NOT_FOUND (404) | 4xx | For the Directions API (Legacy), this message indicates that at least one of the locations specified in the request's origin, destination, or waypoints couldn't be geocoded. For theGeolocation API, this message indicates that the inputs weren't sufficient to produce a location estimate. For theRoads API, this message indicates that the inputs couldn't be reasonably snapped to roads. This is a billable request and will consume quota. |
| UNKNOWN_ERROR | 5xx | Server error indicating that request cannot be proceeded: internal error, service overloaded, not available, time out, and others. |
1To improve the consistency of error code reporting, Google Maps PlatformAPIs are migrating: 1) from HTTP response code class2xx to4xx forMaps API statuses:DATA_NOT_AVAILABLE,NOT_FOUND,ZERO_RESULTS -status,2) from HTTP response code class2xx to4xx forMaps API statuses:REQUEST_DENIED,OVER_DAILY_LIMIT,OVER_QUERY_LIMIT,dailyLimitExceeded,rateLimitExceeded,userRateLimitExceeded,3) from HTTP response code class2xx to5xx forMaps API status:UNKNOWN_ERROR.You can see both response codes during the transitionperiod. Response codes returned in Maps API responses arenot changing.Confirm that an increase in4xx and/or5xx inGoogle Maps Platform Metricsis related to this migration by checking which exact response code increases intheMetrics Explorer(learn more on usingGoogle Cloud Monitoring for Google Maps Platform).
For more information about status codes and error messages, see the responsedocumentation for the API you are interested in (for example,GeocodingResponses orDirections Responses).
Google Maps Platform solutions parameter
Google Maps Platform provides many types of sample code to help you get upand running quickly. For example, you can useQuick Builder inCloud console, follow the industry solutionsimplementation guides,and learn fromcodelabs.
To understand usage and ways to improve our solutions, Google includes thesolution_channel query parameter in API calls to gather information aboutsample code usage:
- The
solution_channelquery parameter is included by default in solution sample code. - The query parameter returns analytics on solution adoption to Google to improve solution quality in future iterations.
- You can opt out by deleting the
solution_channelquery parameter and its value from sample code. - There is no requirement to keep the parameter. Removing the query parameter does not affect performance.
- The query parameter is only used for sample code usage reporting.
- The query parameter is separate from any API-specific analytics and reporting. That means removing the parameter from solution sample code does not disable internal Maps JavaScript API reporting.
Quota reports
Quotas set limits on the number of requests your project can make to theGoogle Maps Platform APIs. Requests can be limited in three ways: per day,per minute, and per user per minute. Only successful requests and requests thatcause server errors count against quota. Requests that fail authentication don'tcount against quota.
Quota usage is displayed in graphs on theQuotas page in the Cloud console, and can be grouped in requests per minute. Thecurrent quota limits for selected APIs are displayed in tables below the quotausage graphs.
To get your per-minute quota value for any GMP API product, use thiscalculator.
Google Maps Quotas page
The Google MapsQuotas page shows quota limits and quotaconsumption for the specific API you have selected.
The quota usage chart on the Google Cloud console shows the total traffic for yourAPI keys and client IDs. Client ID traffic is also available in the Metricschart on the Cloud console.
The page shows only requests that consume quota: successful requests (OK,ZERO_RESULTS,DATA_NOT_AVAILABLE) and requests that cause server errors(NOT_FOUND,INVALID_REQUEST/INVALID_VALUE (invalid parameter value), andUNKNOWN_ERROR).
Requests that cause client errors — authentication, authorization, andinvalid argument errors (REQUEST_DENIED,OVER_QUERY_LIMIT,INVALID_REQUEST(invalid parameter, request parsing error)) — don't consume quota and arenot displayed.
The quota unit is a request for most of the Google Maps Platform APIs (Maps Static API, Street View Static API,Geocoding API, Directions API (Legacy),Places API, Time Zone API,Geolocation API, and Elevation API), but there aresome exceptions:
- For the Distance Matrix API (Legacy), the quota unit is an elementwhich is an origin-destination pair.
- For the Maps JavaScript API, the quota unit is a map load.
- For the Maps SDK for Android and Maps SDK for iOS, thequota unit is a Street View request or Panoramaload. Map loads are available at no charge and don't consume quota.

To access Google Maps Platform Quotas page:
- Open the Google Maps Platform page in the Cloud console:
- In the left menu, selectQuotas.
- Select an API from the API drop-down list.
Quota units
This table shows the quota unit for the Google Maps Platform APIs.
| Google Maps Platform API | Quota Unit |
|---|---|
| Maps | |
| Maps SDK for Android | 1 Panorama |
| Maps SDK for iOS | 1 Panorama |
| Map Tiles API | 1 Request |
| Maps Aerial View API | 1 Request |
| Maps Static API | 1 Request |
| Maps JavaScript API | 1 Map Load |
| Street View Static API | 1 Request |
| Maps Embed API | 1 Map Load |
| Routes | |
| Routes API (Compute Routes) | 1 Request |
| Routes API (Compute Route Matrix) | 1 Element (origin-destination pair) |
| Directions API (Legacy) | 1 Request |
| Distance Matrix API (Legacy) | 1 Element (origin-destination pair) |
| Roads API | 1 Request |
| Route Optimization API | 1 Request |
| Navigation SDK for Android | 1 Destination |
| Navigation SDK for iOS | 1 Destination |
| Places | |
| Places API | 1 Request |
| Places Aggregate API | 1 Request |
| Address Validation API | 1 Request |
| Geocoding API | 1 Request |
| Geolocation API | 1 Request |
| Time Zone API | 1 Request |
| Environment | |
| Air Quality API (CurrentConditions and HeatmapTile) | 1 Request |
| Air Quality API (History) | 1 page |
| Pollen API | 1 Request |
| Solar API | 1 Request |
| Weather API | 1 Request |
Billing reports
View your billing report
Billing reports for your use of the Google Maps Platform products areavailable in the Google Cloud console. For more information, seeBilling.
To access the billing reports:
- Open the Project selector page in the Cloud console:
- Select a project.
- Select the menu button and then selectBilling.
- If you have multiple billing accounts, selectGo to linked billing account to open theOverview page for the linked billing account.
- In the left menu, selectReports to open the billingReports page for the linked billing account.
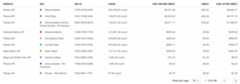
How to read the billing report chart
Billing reports plot cost over time as a stacked line chart. The default viewdisplays the current month's daily usage-specific costs grouped by project (forall products), inclusive of any usage-specific credits applied, as well as thetotal forecasted cost for the entire current month. Each line in the chart (androw in the summary table) corresponds to the project, ranked largest to smallestby cost.Learn moreabout interpreting the billing report chart.

Tip: Analyze the usage and cost per SKU
To more accurately understand the details of the pay-as-you-go pricing model andhow it impacts your implementation, look at your usage and cost by SKU.
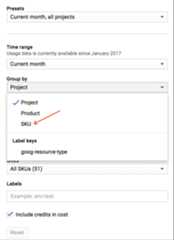
To change the report view to display line items by SKU:
- In the panel to the right of the chart, expand theGroup by filter.
- SelectSKU.
Other billing-report filters available includeTime range,Projects,Products,SKUs, andLocations which lets you filter bywherethe API requests are served from.
To categorize the source of your usage in addition to the product, group billingreports by one of the listed values. The three keys that relate toGoogle Maps Platform APIs aregoog-maps-api-key-suffix (the final fourcharacters of an API key),goog-maps-platform-type (the platform: Android,iOS, JavaScript or webservice), andgoog-maps-channel (a set numeric channelvalue from an API query).Moreinformation on filtering and grouping.
You can change the chart view to exclude usage-specific credits by clearing theInclude credits in cost checkbox in the right panel.
Monitor and restrict consumption
To help you to plan your budget and control costs, you can do the following:
alert, to track how your spend is growing toward a particular amount. Abudget does not cap API usage, it only alerts you when your spend amountgets near the specified amount.
usage, to manage your cost of use of billable APIs. By setting caps onrequests per day, you can limit your spend. Use an equation to determineyour daily cap depending on how much you want to spend. For example:(Monthly spend / price per each SKU) / 30 = requests per day cap (for oneAPI).
Note: Your implementation may use multiple billable APIs that in turn usemultiple SKUs, so adjust your equation as needed. Factor into yourcalculations the amount of no-charge monthly usage that each API provides,shown in thepricing list.
Usage tracking per channel
To track your usage using numeric channels, you must add the 'channel' parameterto your API requests. The only acceptable channel values are numbers from 0-999.Here are a few examples:
- Geocoding Web Service API
https://maps.googleapis.com/maps/api/geocode/json?address=1600+Amphitheatre+Parkway,+Mountain+View,+CA&key=YOUR_API_KEY&channel=1
- Maps JavaScript API
<script src="https://maps.googleapis.com/maps/api/js?key=YOUR_API_KEY&channel=2&callback=initMap"async defer></script>
Monitor your channel usage directly on your Billing Report. Channel usage isunderLabels as keygoog-maps-channel.
Note: Channel data is not available for Maps SDK for Android,Maps SDK for iOS, Places API (New), Places SDK for Android,Places SDK for iOS, Navigation SDK for Android, Navigation SDK for iOS, Places Aggregate API, Address Validation API, Aerial View API, Air Quality API, Map Tiles API,Maps Datasets API, Roads API, Routes API,Pollen API, Solar API,Route Optimization API, and Weather API.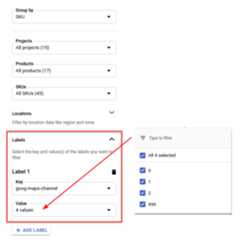
To filter your billing report by SKU and channel
- Use theGroup by SKU filter.
- Select theLabels caret.
- From theKey drop-down, selectgoog-maps-channel.
- From theValue drop-down, select the numerical channels you want tofilter.
Group by Label keygoog-maps-channel to see the cost generated by eachchannel.
Once you have implemented channel usage data in your requests, there may be ashort delay (up to 24 hours) before the data is reflected in your billingreport.
Export your billing data with BigQuery
You can alsoexport your billing datatoBigQuery.
Use BigQuery Export to export detailed Cloud Billing data (such as usage andcost estimate data) automatically throughout the day to aBigQuery dataset that you specify. Then you can access your billing datafrom BigQuery for detailed analysis. This gives an extra layer of granularity inunderstanding the source of your Google Maps Platform usage.
If you'd like to get started with BigQuery exports and querying the data, youcan try the sample query below. Prior to running this query, you must:
- Enable billing and BigQuery billing export on your account.
- The table format isPROJECT_ID.DATASET_NAME.gcp_billing_exportv1BILLING_ACCOUNT_ID where:
- PROJECT_ID is your actual project ID (e.g. "my-project-123456").
- DATASET_NAME is the name of the dataset you created (e.g. "SampleDataSet").
- BILLING_ACCOUNT_ID is a reference of your Billing Account ID, prefixed with "gcp_billing_exportv1", and changing dashes (-) to underscores (_). For example, billing account ID123456-7890AB-CDEF01 would become
gcp_billing_export_v1_123456_789AB_CDEF01.
#standardSQLSELECTDate(usage_start_time,"America/Los_Angeles")ASbilling_day,invoice.monthASinvoice_month,service.descriptionASservice,sku.descriptionASsku,(SELECTl.valueFROMUnnest(labels)ASlWHEREl.KEY='goog-maps-channel')ASgoog_maps_channel,Round(Sum(usage.amount),2)ASusage_amount,usage.unitASusage_unit,Round(Sum(cost),2)AScost,cost_type,currencyFROMPROJECT_ID.DATASET_NAME.gcp_billing_export_v1_BILLING_ACCOUNT_IDWHEREinvoice.month='202002'-- Change the invoice month with the same format as the example.GROUPBYbilling_day,invoice_month,service,sku,goog_maps_channel,usage_unit,cost_type,currencyORDERBYbilling_day,service,skuRelated resources
Cloud Billing:
- Create, modify, or close your Cloud Billing account
- Modify a project's billing settings
- View Your Billing Reports and Cost Trends
- Set budgets and budget alerts
- Capping API Usage
Response status and reports
The table below shows mapping between the Maps API status, HTTP response codereturned in Maps API responses and HTTP response code class in Usage Report, andindicates if the corresponding request appears in the Usage, Quota, and Billingreports.
Note: For historical reasons, the HTTP response code returned in response toGoogle Maps Platform API requests can be different from the HTTP response codein Usage reports (Google Maps Platform Metrics).The Usage Reports metrics use a set of response code values that are consistent with those used in newer APIs. This improves the observability of APIs usage inGoogle Maps Platform MetricsandGoogle Maps Platform Monitoring.The Usage Report inGoogle Maps Platform Metrics
provideHTTP response code class granularity. If you need a higher level ofgranularity seeResponse status codes
available inGoogle Maps Platform Usage monitoring.
| Response codes available in Maps API responses | Available in Usage Report | Reported to | |||
|---|---|---|---|---|---|
| Maps API status | HTTP response code | HTTP response code class | Usage | Quota | Billing |
| OK | 200, 204, 302 | 2xx, 3xx | Yes | Yes | Yes |
| DATA_NOT_AVAILABLE, NOT_FOUND, ZERO_RESULTS | 200, 404 | 4xx1 | Yes | Yes | Yes |
| INVALID_REQUEST (invalid parameter value), MAX_ROUTE_LENGTH_EXCEEDED, MAX_WAYPOINTS_EXCEEDED, etc. | 200, 400 | 4xx | Yes | Yes | Yes |
| INVALID_REQUEST (invalid/missing parameter, request parsing error) | 200, 400 | 4xx | Yes | No | No |
| REQUEST_DENIED | 200, 400, 403 | 4xx1 | Yes | No | No |
| OVER_DAILY_LIMIT, OVER_QUERY_LIMIT, RESOURCE_EXHAUSTED, dailyLimitExceeded, rateLimitExceeded, userRateLimitExceeded | 200, 403, 429 | 4xx1 | Yes | No | No |
| UNKNOWN_ERROR | 200, 500, 503 | 5xx1 | Yes | Yes | No |
1 To improve the consistency of error code reporting, Google Maps PlatformAPIs are migrating: 1) from HTTP response code class2xx to4xx forMaps API statuses:DATA_NOT_AVAILABLE,NOT_FOUND,ZERO_RESULTS -status,2) from HTTP response code class2xx to4xx forMaps API statuses:REQUEST_DENIED,OVER_DAILY_LIMIT,OVER_QUERY_LIMIT,dailyLimitExceeded,rateLimitExceeded,userRateLimitExceeded,3) from HTTP response code class2xx to5xx forMaps API status:UNKNOWN_ERROR.You can see both response codes during the transitionperiod. Response codes returned in Maps API responses arenot changing.Confirm that an increase in4xx and/or5xx inGoogle Maps Platform Metricsis related to this migration by checking which exact response code increases intheMetrics Explorer(learn more on usingGoogle Cloud Monitoring for Google Maps Platform). | |||||
Engagement reports
This product or feature is Experimental (pre-GA). Pre-GA products and features might have limited support, and changes to pre-GA products and features might not be compatible with other pre-GA versions. Pre-GA Offerings are covered by theGoogle Maps Platform Service Specific Terms. For more information, see thelaunch stage descriptions.
Business Insights
Google Maps Platform gives you insights into how users engage with your maps. These insights include key engagement metrics such as views on a map or interactions with a POI. You can analyze these insights to uncover popular locations for advertising and marketing or to optimize your user experience.
Business insights reporting capabilities include:
- Viewing a high-level business insights snapshot to see key trends in business insights at a glance
- Drilling down to analyze a specific metric within the console to deep dive into understanding metrics in more detail
- Exporting metrics to CSV so you can analyze business insights data in your favorite business analysis tool
Engagement metrics available include:
- Map Views: Track views on the map resulting from pans, zooms, or tilts. Map Views are computed by postal code on a weekly basis (Sunday to Saturday Pacific time). New data is released weekly on the first Wednesday following the observation period.
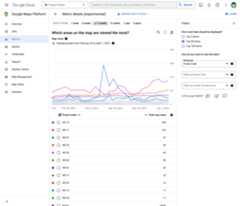
Project owners and users with theMaps Analytics Viewer role can view business insights in theMetrics Page in Cloud Console. The project must haveMaps JavaScript API enabled.
You can analyze engagement metrics directly in the console with Filter and Group By capabilities to deep dive into metrics in more detail. For example, you might choose to filter by a specific region to learn how map views are trending for only postal codes in that region. On the other hand, you might want to group by a specific region to aggregate interactions within that region.
Users can export the entire dataset or a filtered view to CSV to analyze further in your favorite business analysis tool. You can download up to 90 days at a time and downloads greater than 60K cells will be truncated. Exporting map views data to CSV may take a few minutes depending on the selected time range.
Business insights metrics are anonymized and therefore only reflect overall trends in engagement with your maps. Low counts may be rounded to zero and contributions from outliers may be reduced.
You can control access to business insights for your Cloud project in the Google Cloud Console using the Maps Analytics permission. Project Owners are granted this permission by default and can provision access to other users as needed.
Business insights should not be used to estimate your usage costs. Please refer tousage reports for more usage information.
Except as otherwise noted, the content of this page is licensed under theCreative Commons Attribution 4.0 License, and code samples are licensed under theApache 2.0 License. For details, see theGoogle Developers Site Policies. Java is a registered trademark of Oracle and/or its affiliates.
Last updated 2025-11-21 UTC.