Style zoom levels

Page Summary
Customize the appearance of map elements, like water color, at different zoom levels for a dynamic user experience.
Override inherited styles by checking the "Customize across zooms" checkbox and adding zoom-specific customizations.
Zoom level customizations affect that level and all higher levels, ensuring visual consistency as users zoom out.
Easily revert to inherited styles by removing zoom stops, providing flexibility in design.
Create or update map styles in the Google Cloud console Style Editor and publish them to make changes visible on your maps.
Availability: This feature is visible on Android, iOS, JavaScript, andMaps Static.
Better tailor your map to the needs of your users by highlighting featuresat the zoom level that the map is viewed at. For example, you can highlightPOIs or roads once viewers have zoomed into a particular location of interest.
You can style map feature elements to appear the same at all zoom levels on amap, or for some elements, you can create different styles for different zoomlevels.
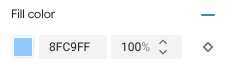
Not all features allow you to customize zoom levels. Map feature elementsthat you can set zoom-level styling on have a diamond icon to the right.
![]()
Understand zoom-level styling
Zoom levels go from 0, the most zoomed out, showing the world, to 22, themost zoomed in, showing a small detailed part of the map. Akeyzoom is azoom level where you want to start a new style.
When you style map features at different zoom levels, that style applies toall higher zoom levels (more zoomed in) until another zoom level style isreached. Zoom level 0 is always added with the current style.
For example, if you set styles at zoom levels 5 and 10:
- The zoom level 5 style applies to zoom levels 5-9.
- The zoom level 10 style applies to zoom levels 10-22.
- Zoom levels 0-4 keep the current style.
When you customize a zoom-level style for a map feature, it overrides anycustom styles on the overall map feature.
Note: Very few map features are shown at all zoom levels. The styles youdefine are only applied at zoom levels where the map feature is visible.Understand zoom level transitions for 3D maps
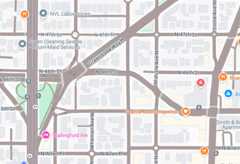
When you tilt a 3D map and transition between zoom levels, you may seetransition colors outside of your set zoom-level styles.
For example, if you set the zoom-level styles as follows:
- For zoom level 10, water fill color = black.
- For zoom level 11, water fill color = white.
The water fill color may appear as gray when transitioning between the two zoomlevels, as shown in the following figure:

Customize different zoom levels
In the Cloud console, go toMap Styles,and select a project, if needed.
Create or open a map style, and selectCustomize.For details, seeCreate a map style.
From theMap Features panel, select a map feature to customize. The style panelopens showing the elements you can customize.
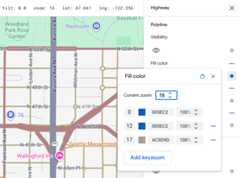
Next to the element to which you want to add zoom-level styling, selectthe zoom diamond to the right to open the keyzoom panel.
Next toCurrent Zoom, select the zoom level you want tocustomize. The preview map adjusts to that zoom level.
Note: The keyzoom panel shows all the available default basemapcolor values for their respective keyzooms if the map feature has not yetbeen customized.
SelectAdd Keyzoom to add a new keyzoom atthe selected zoom level and shows the respective default basemap value.

Style this zoom level and any other zoom levels as needed.
Note: Zoom-level styling applies to the selected zoom level and higher(more zoomed in). So, in this case,Fill color is black (the currentstyle set for the element), from zoom level 12 to 22, blue fromzoom levels 0 (the world) to 9, and a lighter blue from zoom levels 10 to11.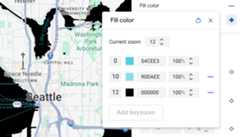
To set another zoom level, change theCurrent Zoom and selectAdd Keyzoom again to add another zoom level to the list. Continueadding and setting zoom level styles until you are done.
When you're finished, close the keyzoom panel.
Overwrite the default basemap color values for an element
To overwrite all default basemap color values for an element across zoom levels,first style the element. When you add keyzooms, the keyzoomuses the color you set for the element instead of the default basemap color.
Save and publish zoom-level styling
To save your map styling changes, selectSave.
To make your changes live for the map IDs associated with your map style,selectPublish.
Remove a zoom level style
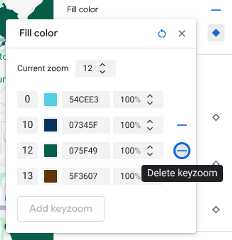
From theMap Features panel, select a customized map feature.
Next to a style element, select the diamond on the right.Elements with custom zoom-level styling show a solid blue diamond.

In the keyzoom panel, select the minus icon todelete a zoom level.
Remove all zoom level styles
If you want to remove all custom styling from a map feature element, you can do one of the following:
- In thestyle panel, select the minus icon next to the element name.
- In thekeyzoom panel, select the reset icon next to the element name.
Preview road level details
You can preview enhanced road level details at zoomlevels 17+ on your existing styles such as realistic road widths, sidewalks,lane markings and other features in select cities. You must enable the previewfor each style editor session. These road detail map features are only visibleon the SDKs or APIs that support road level details. To apply them in your app,you must update the associated SDK or API to the version that supports roadlevel details. For more information about the API and SDK versions, seeRoadlevel details for Google Maps Platform.
To enable the road detail preview, do the following:
In the Google Cloud console, go toMap Styles.
Select an existing style orCreate a style.
ClickCustomize.
In the style editor, clickRoad detail preview.
In the preview dialog, toggleRoad detail to on.
For details on which road level details you can style, seeWhat you can styleon the map.
Add zoom level styles to soften style transition for zoom levels 17+
At zoom levels 17+ with road level details enabled, Road map features disappearand become the Surface map feature instead. As you zoom in, any styled elementsthat apply to the Surface map feature appear and replace the Road map featuresand styles.
To make the transition between the map feature styles smoother, you can add zoomlevel styles to lock in your style colors between specific zoom levels. You canuse zoom level styles to also control when to smoothly transition to a new stylecolor.
For example, at zoom level 16, the listed map features are styled as follows:
- Arterial is red.
- Highway is blue.
- Local is yellow.
- Surface is beige.
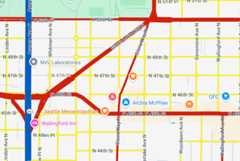
When you zoom in to zoom level 17, the arterials, highways, and local roadschange to the Surface map feature, which is styled as beige.
To create a smoother transition between the Road map features and the Surface map feature, add the following keyzooms and zoom-level styling:
| Map feature | Zoom level 0 | Zoom level 12 | Zoom level 17 |
|---|---|---|---|
| Arterial | red | red | beige |
| Highway | blue | blue | beige |
| Local | yellow | yellow | beige |
After adding zoom-level styling, when you zoom in, the following occurs:
- The arterials, highways, and local roads display the custom styled colorfrom zoom levels 0 to 12.
- After zoom level 12, the styled color begins to fade into the beige coloruntil fully transitioning to the beige color from the Surface map featurestyle at zoom level 17.
Except as otherwise noted, the content of this page is licensed under theCreative Commons Attribution 4.0 License, and code samples are licensed under theApache 2.0 License. For details, see theGoogle Developers Site Policies. Java is a registered trademark of Oracle and/or its affiliates.
Last updated 2025-12-11 UTC.