Neural networks

Page Summary
This module explores neural networks, a model architecture designed to automatically identify nonlinear patterns in data, eliminating the need for manual feature cross experimentation.
You will learn the fundamental components of a deep neural network, including nodes, hidden layers, and activation functions, and how they contribute to prediction.
The module covers the training process of neural networks, using the backpropagation algorithm to optimize predictions and minimize loss.
Additionally, you will gain insights into how neural networks handle multi-class classification problems using one-vs.-all and one-vs.-one approaches.
This module builds on prior knowledge of machine learning concepts such as linear and logistic regression, classification, and working with numerical and categorical data.
- Explain the motivation for building neural networks, and the use cases they address.
- Define and explain the function of the key components of a deep neural network architecture:
- Develop intuition around how neural network predictions are made, by stepping through the inference process.
- Build a high-level intuition of how neural networks are trained, using the backpropagation algorithm.
- Explain how neural networks can be used to perform two types of multi-class classification: one-vs.-all and one-vs.-one.
This module assumes you are familiar with the concepts covered in the following modules:
- Introduction to Machine Learning
- Linear regression
- Logistic regression
- Classification
- Working with numerical data
- Working with categorical data
- Datasets, generalization, and overfitting
You may recall from theFeature cross exercisesin theCategorical data module,that the following classification problem is nonlinear:
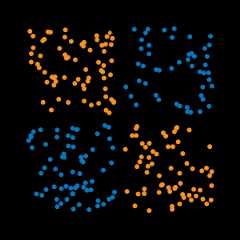
"Nonlinear" means that you can't accurately predict a label with amodel of the form \(b + w_1x_1 + w_2x_2\). In other words, the"decision surface" is not a line.
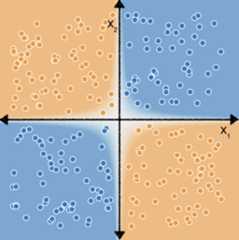
However, if we perform a feature cross on our features $x_1$ and $x_2$, we canthen represent the nonlinear relationship between the two features using alinear model:$b + w_1x_1 + w_2x_2 + w_3x_3$ where $x_3$ is the feature cross between$x_1$ and $x_2$:
Now consider the following dataset:

You may also recall from theFeature cross exercisesthat determining the correct feature crosses to fit a linear model to this datatook a bit more effort and experimentation.
But what if you didn't have to do all that experimentation yourself?Neural networks are a familyof model architectures designed to findnonlinearpatterns in data. During training of a neural network, themodel automaticallylearns the optimal feature crosses to perform on the input data to minimizeloss.
In the following sections, we'll take a closer look at how neural networks work.
Key terms:Except as otherwise noted, the content of this page is licensed under theCreative Commons Attribution 4.0 License, and code samples are licensed under theApache 2.0 License. For details, see theGoogle Developers Site Policies. Java is a registered trademark of Oracle and/or its affiliates.
Last updated 2025-08-25 UTC.