It is 2025, almost 13 years since Node.js exists and I have seen people still debugging their backend code using console.log. 🤯😩
I am experienced in building .NET web APIs applications as well. The Visual Studio IDE (Not VS Code) indeed has some sophisticated tools for debugging, like step into function, next line, come out of function, check running memory usage etc. I enjoyed coding in that phase of my career.
Recently since I started using Node.js in a project, I always wondered how? How the whole team in this project is missing their debugging console logs in production code? How come no one is usingnode inspect server.js ? WHYYY???? (Sorry, I made this sound like an Instagram reel)
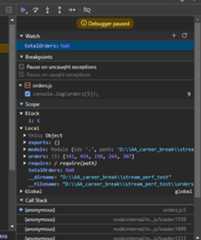
Mentioned below are the steps to use a debugger for Node.js that looks like this:
Prerequisites
The mentioned below software should be installed on your system:
- Node.js
- Chrome browser
Step by step guide
1) You should have something to debug. If don't, then use the code sample below and save it in a file called orders.js in your project directory.
// orders.jslet orders = [341, 454, 198, 264, 307];let totalOrders = 0;for (let i = 0; i <= orders.length; i++) { totalOrders += orders[i];}console.log(totalOrders);2) Run the above code using following command in the terminal.
node orders.jsIt returnedNaN which is expected. (Since in the last iteration, we did sum + undefined (orders[5])).
3) To debug this code line by line, run the mentioned below command:
node inspect orders.jsThis will start a console like this:
< Debugger listening on ws://127.0.0.1:9229/148789b7-6788-40b5-beb1-d15c246dcda7< For help, see: https://nodejs.org/en/docs/inspector<connecting to 127.0.0.1:9229 ... ok< Debugger attached.Wait till< Debugger attached. appears on your console.
4) Go tochrome://inspect on your Chrome browser. This opens chrome devtools. From the log mentioned in above step, Debugger is attached on port9229. You will see the same under localhost section. Refer to the image below:
5) Click oninspect and you will see a familiar looking window! 😃
Next steps:
Explore the right hand side of this screen which has these features:
1) Watch
2) Breakpoints
3) Scope
4) Call stack
Note
Debuggers are powerful tools. Obvious human errors are caught in a sight (like in the example given above), but sometimes, you need to use debugger.
On a higher note
Now that I have made easy for you to debug the code, do not overkill on a bug using this debugger as your go-to solution. Get the overview of the code, understand the pain points like slow running functions, memory usage spiking functions etc and narrow down the scope of your debugging first.
Have some entities to keep a watch on first and also, understand the how Node.js executes the js code in the main thread. Combining your own diagnosis skills along with debuggers will not let AI take-over your job for sure!
References:
https://nodejs.org/en/learn/getting-started/debugging#chrome-devtools-55-microsoft-edge
https://www.digitalocean.com/community/tutorials/how-to-debug-node-js-with-the-built-in-debugger-and-chrome-devtools
Top comments(1)
For further actions, you may consider blocking this person and/orreporting abuse


