Color connection lines within EER diagrams provide quick visual information about how the tables in your model relate. Existing connection lines are highlighted when you use a pointer device to hover on different database objects. The following table defines the meaning of each color and indicates how you can open the underlying table information from your diagram.
Table 9.1 MySQL Workbench Color Key for EER Diagrams
| Color | Hover On | Meaning | Related Action |
|---|---|---|---|
| Golden yellow | Connection line | Highlights the fields represented by the connection between two tables (seeFigure 9.10, “Golden Yellow Highlight”). | Double-click to open theRelationship tab. |
| Green | Table name | Shows all of the outgoing relationships (foreign keys) defined on the table in focus, which reference a different table (seeFigure 9.11, “Green and Blue Highlight”). | Double-click to open theTable tab. |
| Blue | Table name | Shows all of the incoming relationships (foreign keys) defined in another table, which end on the table in focus (seeFigure 9.11, “Green and Blue Highlight”). | Double-click to open theTable tab. |
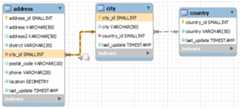
Hover on a connection between tables to highlight the line and the related fields. In the following figure, the connection betweenaddress andcity tables is highlighted, together with theaddress.city_id andcity.city_id fields. The small box near the pointer indicates that you can open a tab containing relationship information.
The presence of green and blue highlighting is determined by the table in focus. Line color changes dynamically when you move the focus from one table to another. As the next figure shows, hovering on theaddress,city, andcountry table names sequentially causes the connection line (or lines) and related fields to change color. For the meaning of each color, seeTable 9.1, “MySQL Workbench Color Key for EER Diagrams”. The small box near the pointer indicates that you can open a tab containing table information.
