Use query insights to improve query performance
This page describes how to use the Query insights dashboard todetect and analyze performance problems with your queries.
Introduction
Query insights helps you detect, diagnose, and prevent query performance problemsfor Cloud SQL databases. It supports intuitive monitoring and providesdiagnostic information that helps you go beyond detection to identify theroot cause of performance problems.
With query insights, you can monitor performance at an application level andtrace the source of a problematic query across the application stack by model,view, controller, route, user, and host. The query insights tool can integratewith your existing application monitoring (APM) tools and Google Cloudservices by using open standards and APIs. This way, you can monitor andtroubleshoot query problems by using your favorite tool.
Query insights helps you improve Cloud SQL query performance by guiding youthrough the following steps:
- View the database load for top queries
- Identify a potentially problematic query or tag
- Examine the query or tag to identify issues
- Examine a trace generated by a sample query
Query insights for Cloud SQL Enterprise Plus edition
If you're using Cloud SQL Enterprise Plus edition, then you can access additional capabilities inquery insights to perform advanced query performance diagnostics. In addition tothe standard capabilities of the Query insights dashboard,query insights for Cloud SQL Enterprise Plus edition lets you do the following:
- Capture and analyze wait events for all executed queries.
- Filter aggregated database load by additional dimensions such as queries, tags, wait event types, and more.
- Capture query plans for all executed queries.
- Sample up to 200 query plans per minute.
- Capture longer query text up to 100 KB.
- Obtain near real-time updates for metrics (in the order of seconds).
- Maintain a longer 30-day retention of metrics.
- Obtain index recommendations from index advisor.
- Terminate a session or long-running transaction in active queries.
- Access AI-assisted troubleshooting (Preview).
The following table compares functional requirements and capabilities ofquery insights for Cloud SQL Enterprise edition with query insights for Cloud SQL Enterprise Plus edition.
| Comparison area | Query insights for Cloud SQL Enterprise edition | Query insights for Cloud SQL Enterprise Plus edition |
|---|---|---|
| Supported database versions | PostgreSQL 9.6 or later | PostgreSQL 12 or later |
| Supported machine types | Supported on all machine types | Not supported on instances that use ashared core machine typeor on read replica instances |
| Supported regions | Cloud SQL regional locations | Cloud SQL Enterprise Plus edition regional locations |
| Metrics retention period | 7 days | 30 days |
| Query length limit maximum | 4500 bytes | 100 KB |
| Query plan sample maximum | 20 | 200 |
| Wait event analysis | Not available | Available |
| Index advisor recommendations | Not available | Available |
| Terminate sessions or long-running transactions in active queries | Not available | Available |
| AI-assisted troubleshooting (Preview) | Not available | Available |
| Query cardinality limits | Reports the aggregated statistics for up to the top 100 queries with a combination of client IP addresses, databases, application tag, usernames, and query text per day. | Reports the aggregated statistics for up to the top 4,000 queries with a combination of application tag, databases, usernames, and query ID per minute. |
Enable query insights for Cloud SQL Enterprise Plus edition
To enable query insights for Cloud SQL Enterprise Plus edition, selectEnable Enterprise Plus features when youEnable query insights on your Cloud SQL Enterprise Plus edition instance.
Pricing
You can create an account to evaluate how Cloud SQL performs in real-world scenarios. New customers also get $300 in free credits to spend on Cloud SQL to run, test, and deploy workloads. You won't be charged until you upgrade.
Sign up to try Cloud SQL at no charge.
There's no additional cost for query insights on Cloud SQL Enterprise edition orCloud SQL Enterprise Plus edition instances.
Storage requirements
Query insights for Cloud SQL Enterprise edition doesn't occupy any storage space in your Cloud SQLinstance storage space. Metrics are stored in Cloud Monitoring. For API requests,see Cloud MonitoringPricing.Cloud Monitoring has a tier that you can use at no additional cost.
Query insights for Cloud SQL Enterprise Plus editionstores metrics data on the same disk attached toyour Cloud SQL instance and requires that youkeep the automatic storage increases setting enabled.
The storage requirement for seven daysworth of data is approximately 36 GB.For 30 days, you need approximately 155 GB.Query insights for Cloud SQL Enterprise Plus edition uses up to10 MB of RAM (shared memory).Metrics are expected to be available inquery insights within 30 seconds of query completion.Applicable storage fees apply.Limitations
The following limitations apply to query insights for Cloud SQL Enterprise Plus edition instances:
- If your instance is undergoing heavy system load, then when you query metrics data in theQuery insights dashboard, your queries might be slow to load or time out.
- When restoring a query insights for Cloud SQL Enterprise Plus edition instance from an older backup, you might lose the metrics collected between the time the backup was taken and the time you restore the instance. For example, if you restore your instance on April 30 with a backup taken on April 25, then you might lose all the metrics between April 25 and April 30.
- If your instance uses PostgreSQL 18 and your query has comment tags before the start of your SQL statement, then your application tags might not be stored when using query insights. This limitation applies to Cloud SQL Enterprise Plus edition and Cloud SQL Enterprise edition instances.
Before you begin
Before you use query insights, do the following.
- Add required roles and permissions.
- Enable the Cloud Trace API.
- If you're using Query insights for Cloud SQL Enterprise Plus edition, then make sure thatEnable automatic storage increases isenabled for the instance.
Required roles and permissions
To get the permissions that you need to access historical query execution data in the Query insights dashboard, ask your administrator to grant you the following IAM roles on the project that hosts the Cloud SQL instance:
- Database Insights Monitoring Viewer (
roles/databaseinsights.monitoringViewer) - Cloud SQL Viewer (
roles/cloudsql.viewer)
For more information about granting roles, seeManage access to projects, folders, and organizations.
You might also be able to get the required permissions throughcustom roles or otherpredefined roles.
Enable the Cloud Trace API
To view query plans and their end-to-end views, your Google Cloud projectmust have the Cloud Trace API enabled. This setting lets yourGoogle Cloud project receive trace data from authenticated sources at noadditional cost. This data can help you detect and diagnose performance issuesin your instance.
To confirm that the Cloud Trace API is enabled, follow these steps:
- From the Google Cloud console, go toAPIs and Services:
- ClickEnable APIs and Services.
- In the search bar, enter
Cloud Trace API. - IfAPI enabled is displayed, then this API is enabled and there's nothing for you to do. Otherwise, clickEnable.
Enable automatic storage increases
If you're using query insights for Cloud SQL Enterprise Plus edition, then make sure that the instance settingtoenable automatic storage increasesremains enabled. By default, this option is enabled for Cloud SQLinstances.
If you previously disabled this instance setting and want toenable query insights for Cloud SQL Enterprise Plus edition, then re-enable automatic storage increases first.You can't turn off automatic storage increases and enable query insights for Cloud SQL Enterprise Plus edition.
Enable query insights
Note: Query insights metrics are encrypted at rest.When you enable query insights, all other operations aretemporarily suspended. These operations include health checks, logging,monitoring, and other instance operations.
Important: When you enable query insights for Cloud SQL Enterprise Plus edition,your instance restarts and can take several minutes to become available again.Important: Client IP tracking isn't supportedfor instances with Managed Connection Pooling enabled. If your instance is usingManaged Connection Pooling, then the client IP addresses for ports 3307 and 6432 areshown aslocal.Console
Note: If you don't have query insights enabled on anyof your instances, then you can enable query insights by clickingEnableorEnable for multiple instances ontheQuery insights dashboard.Enable query insights for an instance
In the Google Cloud console, go to theCloud SQL Instances page.
- To open theOverview page of an instance, click the instance name.
- On theConfiguration tile, clickEdit configuration.
- In theCustomize your instance section, expandQuery insights.
- Select theEnable Query insights checkbox.
- Optional: Select additional features for your instance. Some features are available only for Cloud SQL Enterprise Plus edition.
- ClickSave.
| Feature | Description | Cloud SQL Enterprise edition | Cloud SQL Enterprise Plus edition |
|---|---|---|---|
| Enable Enterprise Plus features | Select this checkbox to enable query insights for Cloud SQL Enterprise Plus edition in Cloud SQL. query insights for Cloud SQL Enterprise Plus edition lets you terminate sessions and long-running transactions in active queries and increases metric data retention to 30 days. You must select this checkbox to enable AI-assisted troubleshooting (Preview). | Not available | Available Default: Disabled |
| Active query analysis | Lets you review details about your actively running queries. If enabled on Cloud SQL Enterprise Plus edition, then you can also terminate sessions and long-running transactions. Select this checkbox to enable actives queries for your Cloud SQL for PostgreSQL instance. For more information, seeMonitor active queries. | Available Default: Disabled | Available Default: Disabled |
| Index advisor recommendations | Provides index recommendations to speed up query processing. For more information, seeUse index advisor. Enabling index advisor requires a restart of the instance. Disabling index advisor doesn't require a restart. | Not available | Available Default: Disabled |
| AI-assisted troubleshooting | Select this checkbox to enable performance anomaly detection, root cause and situation analysis, and to obtain recommendations for fixing problems with your queries and database. This feature is is inPreview, and you can enable and access this feature only using the Google Cloud console. For more information, seeObserve and troubleshoot with AI assistance. | Not available | Available Default: Disabled |
| Store client IP addresses | Select this checkbox to enable the storage of client IP addresses. Cloud SQL can store the IP addresses of where queries are coming from and let you group that data to run metrics against it. Queries come from more than one host. Reviewing graphs for queries from client IP addresses can help identify the source of a problem. | Available Default: Disabled | Available Default: Disabled |
| Store application tags | Select this checkbox to enable application tag storage. Storing application tags helps you to determine the APIs and model-view-controller (MVC) routes that are making requests and group the data to run metrics against it. This option requires you to comment queries with a specific set of tags using thesqlcommenter open source object-relational mapping (ORM) auto-instrumentation library. This information helps query insights identify the source of a problem and the MVC from which the problem is coming. Application paths help you with application monitoring. | Available Default: Disabled | Available Default: Disabled |
| Customize query lengths | Select this checkbox to customize the limit for the length of a query string. Higher query lengths are more useful for analytical queries, but they also require more memory. Any query string that goes above the specified limit becomes truncated in the display. Changing the query length limit requires you to restart the instance. You can still add tags to queries that exceed the length limit. | You can set the limit in bytes from256 bytes to4500 bytes.Default: 1024. | You can specify a limit in bytes from1024 to100000.Default: 10000 bytes. |
| Set the maximum sampling rate | Select this checkbox to set the maximum sampling rate. The sampling rate is the number of executed query plan samples that are captured per minute across all databases on the instance. Increasing the sampling rate is likely to give you more data points but might increase performance overhead. To disable sampling, set the value to0. | You change this value to a number from0 to20.Default: 5. | You can increase the maximum to200 to provide more data points.Default: 200 |
Enable query insights for multiple instances
In the Google Cloud console, go to theCloud SQL Instances page.
- Click theMore Actions menu on any row.
- SelectEnable Query insights.
- In the dialog, select theEnable Query insights for multiple instances checkbox.
- ClickEnable.
- In the subsequent dialog, select the instances for which you want to enable query insights.
- ClickEnable Query insights.Note: If you enable query insights for multiple instances, then the configuration of the instances is based on thedefault configurations.
gcloud
To enable query insights for a Cloud SQL instance by usinggcloud, rungcloud sql instances patch with the--insights-config-query-insights-enabled flag as follows after replacingINSTANCE_ID with the ID of the instance.
gcloudsqlinstancespatchINSTANCE_ID\--insights-config-query-insights-enabledAlso, use one or more of the following optional flags:
--insights-config-record-client-addressStores the client IP addresses where queries are coming from and helps you group that data to run metrics against it. Queries come from more than one host. Reviewing graphs for queries from client IP addresses can help identify the source of a problem.
--insights-config-record-application-tagsStores application tags that help you determine the APIs and model-view-controller (MVC) routes that are making requests and group the data to run metrics against it. This option requires you to comment queries with a specific set of tags. You can do this by using thesqlcommenter open source object-relational mapping (ORM) auto-instrumentation library. This information helps Query Insights identify the source of a problem and the MVC the problem is coming from. Application paths help you with application monitoring.
--insights-config-query-string-lengthSets the default query length limit. Higher query lengths are more useful for analytical queries, but they also require more memory. Changing the query length requires you to restart the instance. You can still add tags to queries that exceed the length limit. For Cloud SQL Enterprise edition, you can specify a value in bytes from
256to4500. The default query length is1024bytes. For Cloud SQL Enterprise Plus edition, you can specify a limit in bytes from1024to100000. The default value is10000bytes.--insights-config-query-plans-per-minuteBy default, a maximum of 5 executed query plan samples are captured per minute across all databases on the instance. Increasing the sampling rate is likely to give you more data points but might add a performance overhead. To disable sampling, set this value to
0. For Cloud SQL Enterprise edition, you can change the value from 0 to 20. For Cloud SQL Enterprise Plus edition, you can increase the maximum up to 200 to provide more data points. By default, the maximum sample rate is200query plan samples per minute across all databases on the instance.
Replace the following:
- INSIGHTS_CONFIG_QUERY_STRING_LENGTH: The query string length to be stored, in bytes.
- API_TIER_STRING: Thecustom instance configuration to use for the instance.
- REGION: Theregion for the instance.
gcloudsqlinstancespatchINSTANCE_ID\--insights-config-query-insights-enabled\--insights-config-query-string-length=INSIGHTS_CONFIG_QUERY_STRING_LENGTH\--insights-config-query-plans-per-minute=QUERY_PLANS_PER_MINUTE\--insights-config-record-application-tags\--insights-config-record-client-address\--tier=API_TIER_STRING\--region=REGION
REST v1
To enable query insights for a Cloud SQL instance by using the REST API, call theinstances.patch method withinsightsConfig settings.
Before using any of the request data, make the following replacements:
- PROJECT_ID: the project ID
- INSTANCE_ID: the instance ID
HTTP method and URL:
PATCH https://sqladmin.googleapis.com/v1/projects/PROJECT_ID/instances/INSTANCE_ID
Request JSON body:
{ "settings" : { "insightsConfig" : { "queryInsightsEnabled" : true, "recordClientAddress" : true, "recordApplicationTags" : true, "queryStringLength" : 1024, "queryPlansPerMinute" : 20, } }}To send your request, expand one of these options:
curl (Linux, macOS, or Cloud Shell)
Note: The following command assumes that you have logged in to thegcloud CLI with your user account by runninggcloud init orgcloud auth login , or by usingCloud Shell, which automatically logs you into thegcloud CLI . You can check the currently active account by runninggcloud auth list. Save the request body in a file namedrequest.json, and execute the following command:
curl -X PATCH \
     -H "Authorization: Bearer $(gcloud auth print-access-token)" \
     -H "Content-Type: application/json; charset=utf-8" \
     -d @request.json \
     "https://sqladmin.googleapis.com/v1/projects/PROJECT_ID/instances/INSTANCE_ID"
PowerShell (Windows)
Note: The following command assumes that you have logged in to thegcloud CLI with your user account by runninggcloud init orgcloud auth login . You can check the currently active account by runninggcloud auth list. Save the request body in a file namedrequest.json, and execute the following command:
$cred = gcloud auth print-access-token
$headers = @{ "Authorization" = "Bearer $cred" }

Invoke-WebRequest `
    -Method PATCH `
    -Headers $headers `
    -ContentType: "application/json; charset=utf-8" `
    -InFile request.json `
    -Uri "https://sqladmin.googleapis.com/v1/projects/PROJECT_ID/instances/INSTANCE_ID" | Select-Object -Expand Content
You should receive a JSON response similar to the following:
{ "kind": "sql#operation", "targetLink": "https://sqladmin.googleapis.com/v1/projects/PROJECT_ID/instances/INSTANCE_ID", "status": "PENDING", "user": "user@example.com", "insertTime": "2025-03-28T22:43:40.009Z", "operationType": "UPDATE", "name": "OPERATION_ID", "targetId": "INSTANCE_ID", "selfLink": "https://sqladmin.googleapis.com/v1/projects/PROJECT_ID/operations/OPERATION_ID", "targetProject": "PROJECT_ID"}Terraform
To use Terraform to enable query insights for a Cloud SQL instance, set thequery_insights_enabled flag totrue.
Also, you can use one or more of the following optional flags:
query_string_length: for Cloud SQL Enterprise edition, you can specify a value in bytes from256to4500. The default query length is1024bytes. For Cloud SQL Enterprise Plus edition, you can specify a limit in bytes from1024to100000. The default value is10000bytes.record_application_tags: set the value totrueif you want to record application tags from the query.record_client_address: set the value totrueif you want to record the client IP address. The default isfalse.query_plans_per_minute: for Cloud SQL Enterprise edition, you can set the value from0to20. The default is5. For Cloud SQL Enterprise Plus edition, you can increase the maximum up to200to provide more data points. The default maximum sample rate is200query plan samples per minute across all databases on the instance.
Here's an example:
resource"google_sql_database_instance""INSTANCE_NAME"{name="INSTANCE_NAME"database_version="POSTGRESQL_VERSION"region="REGION"root_password="PASSWORD"deletion_protection=false# set to true to prevent destruction of the resourcesettings{tier="DB_TIER"insights_config{query_insights_enabled=truequery_string_length=2048# Optionalrecord_application_tags=true# Optionalrecord_client_address=true# Optionalquery_plans_per_minute=10# Optional}}}
To apply your Terraform configuration in a Google Cloud project, complete the steps in the following sections.
Prepare Cloud Shell
- LaunchCloud Shell.
Set the default Google Cloud project where you want to apply your Terraform configurations.
You only need to run this command once per project, and you can run it in any directory.
export GOOGLE_CLOUD_PROJECT=PROJECT_ID
Environment variables are overridden if you set explicit values in the Terraform configuration file.
Prepare the directory
Each Terraform configuration file must have its own directory (alsocalled aroot module).
- InCloud Shell, create a directory and a new file within that directory. The filename must have the
.tfextension—for examplemain.tf. In this tutorial, the file is referred to asmain.tf.mkdirDIRECTORY && cdDIRECTORY && touch main.tf
If you are following a tutorial, you can copy the sample code in each section or step.
Copy the sample code into the newly created
main.tf.Optionally, copy the code from GitHub. This is recommended when the Terraform snippet is part of an end-to-end solution.
- Review and modify the sample parameters to apply to your environment.
- Save your changes.
- Initialize Terraform. You only need to do this once per directory.
terraform init
Optionally, to use the latest Google provider version, include the
-upgradeoption:terraform init -upgrade
Apply the changes
- Review the configuration and verify that the resources that Terraform is going to create or update match your expectations:
terraform plan
Make corrections to the configuration as necessary.
- Apply the Terraform configuration by running the following command and entering
yesat the prompt:terraform apply
Wait until Terraform displays the "Apply complete!" message.
- Open your Google Cloud project to view the results. In the Google Cloud console, navigate to your resources in the UI to make sure that Terraform has created or updated them.
Metrics are expected to be available in query insights within minutes of querycompletion. Review theCloud Monitoring dataretention policy.
Query insights traces are stored in Cloud Trace. Review theCloud Trace dataretention policy.
View the Query insights dashboard
The Query insights dashboard shows thequery load based on factorsthat you select. Query load is a measurement of the total work for all thequeries in the instance in the selected time range. The dashboard provides aseries of filters that help you view query load.
To open theQuery insights dashboard, follow these steps:
- To open theOverview page of an instance, click the instance name.
- In the Cloud SQL navigation menu, clickQuery insights, or clickGo to Query insights for more in-depth info on queries and performance on theInstance overview page.
TheQuery insights dashboard opens. Depending on whether you're usingquery insights for Cloud SQL Enterprise edition or query insights for Cloud SQL Enterprise Plus edition, the Query insights dashboardshows the following information aboutyour instance:
Cloud SQL Enterprise Plus edition

- All queries: Shows database load for all queries for the selected time range. Each query is individually color-coded. To view a point in time for a specific query, hold the pointer over the chart for the query.
- Database: Filters query load on a specific database or all databases.
- User: Filters query load from a specific user account.
- Client address: Filters query load from a specific IP address.
- Time range: Filters query load by time ranges, such as 1 hour, 6 hours, 1 day, 7 days, 30 days, or a custom range.
- Wait event types: Filters query load by CPU and Lock wait event types.
- Queries,Wait event types,Databases,Users,Tags, andClient addresses: Sort by the top dimensions that contribute the most to database load in the chart. SeeFilter the database load.
Cloud SQL Enterprise edition

- Database: Filters query load on a specific database or all databases.
- User: Filters query load from a specific user account.
- Client address: Filters query load from a specific IP address.
- Time range: Filters query load by time ranges, such as 1 hour, 6 hours, 1 day, 7 days, 30 days, or a custom range.
- Database load graph: Displays the query load graph, based on filtered data.
- CPU capacity, CPU and CPU wait, IO wait, and Lock wait: Filters loads based on the options that you select. SeeView the database load for top queries for details about each of these filters.
- Queries andTags: Filters query load by either a selected query or a selected SQL query tag. SeeFilter the database load.
View the database load for all queries
Database query load is a measure of the work (in CPU seconds) that the executedqueries in your selected database perform over time. Each runningquery is either using or waiting for CPU resources, IO resources, or lockresources. Database query load is the ratio of the amount of time taken by allthe queries that are completed in a given time window to the wall-clock time.
The top-level query insights dashboard shows theDatabase load — all topqueries graph. Drop-down menus on the dashboard let you filter the graph for aspecific database, user, or client address.
Cloud SQL Enterprise Plus edition

Cloud SQL Enterprise edition

Colored lines in the graph show the query load, split into categories:
- CPU capacity: The number of CPUs available on the instance.
- CPU and CPU Wait: The ratio of the time taken by queries in an active state to wall-clock time. IO and Lock waits don't block queries that are in an active state. This metric might mean that the query is either using the CPU or waiting for the Linux scheduler to schedule the server process running the query while other processes are using the CPU. Note:CPU load accounts for both the runtime and the time waiting for the Linux scheduler to schedule the server process that's running. As a result, the CPU load can go beyond the maximum core line.
- IO Wait: The ratio of time taken by queries that are waiting for IO to wall-clock time. IO wait includes Read IO Wait and Write IO Wait. If you want a breakdown of information for IO waits, you can see it in Cloud Monitoring. SeeCloud SQL metrics for more information. For more information, see the PostgreSQLevent table.
- Lock Wait: The ratio of time taken by queries that are waiting for Locks to wall-clock time. It includes Lock Waits, LwLock Waits, and Buffer pin Lock waits. To see a breakdown of information for lock waits, use Cloud Monitoring. SeeCloud SQL metrics for more information.
Colored lines in the graph show per database load by execution time.Review the graph and use the filtering options to explore these questions:
- Is the query load high? Is the graph spiking or elevated over time? If you don't see a high load, then the problem isn't with your query.
- How long has the load been high? Is it high only now or has it been high for a long time? Use the range selector to select various time periods to find out how long the problem has lasted. Zoom in to view a time window where query load spikes are observed. Zoom out to view up to one week of the timeline.
- What's causing the high load? You can select options to examine the CPU capacity, CPU and CPU wait, Lock wait, or IO wait. The graph for each of these options is a different color so that you can spot the one with the highest load. The dark blue line on the graph shows the maximum CPU capacity of the system. It lets you compare the query load with the maximum CPU system capacity. This comparison helps you determine whether an instance is running out of CPU resources.
- Which database is experiencing the load? Select different databases from the Databases drop-down menu to find the databases with the highest loads.
- Do specific users or IP addresses cause higher loads? Select different users and addresses from the drop-down menus to identify the ones that are causing higher loads.
Filter the database load
You can filter the database load by queries or tags.If you're using query insights for Cloud SQL Enterprise Plus edition, then you can customize the database load chartto break down the displayed data usingany of the following dimensions:All queries
Wait event types
Wait events
Databases
Users
Tags
Client addresses
To customize the database load chart, select a dimensionfrom theDatabase Load by execution time drop-down.
View the top contributors to database load
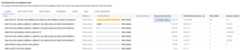
To view the top contributors to the database load,you can use theTop dimensions by database load table.TheTop dimensions by database load table displays the top contributors forthe time period and dimension that you select in theDatabase Load by execution time chart drop-down. You can modify thetime period or dimension to view the top contributors for a different dimensionor time period.
In theTop dimensions by data load table, you can select the following tabs.
| Tab | Description |
|---|---|
| Queries | The table displays the top normalized queries by total execution time. For each query, the data shown in columns are listed as follows:
|
| Wait event types | The table displays the list of top wait event types that occurred during the selected time period. This table is only available for query insights for Cloud SQL Enterprise Plus edition.
|
| Wait events | The table displays the list of top wait events that occurred during the selected time period. This table is only available for query insights for Cloud SQL Enterprise Plus edition.
|
| Databases | The table shows the list of top databases that contributed to the load during the chosen time period across all executed queries.
|
| Users | The table shows the list of top users for the selected time period across all executed queries.
|
| Tags | For information about tags,Filter by query tags. |
| Client addresses | The table shows the list of top users for the selected time period across all executed queries.
|
Filter by queries
TheTop dimensions by database load table provides an overview of thequeries that cause the most query load. The table shows all the normalized queriesfor the time range and options selected on the Query insights dashboard. It sortsqueries by the total execution time during the time range that you selected.
Cloud SQL Enterprise Plus edition
To sort the table, select a column heading.
Cloud SQL Enterprise edition
To sort the table, select a column heading or a property fromFilter queries.

The table shows the following properties:
- Query: the normalized query string. By default, query insights shows only 1024 characters in the query string. Queries labeled
UTILITY COMMANDusually includeBEGIN,COMMIT, andEXPLAINcommands or wrapper commands. - Database: the database against which the query was run.
- Recommendations: the suggested recommendations, such asCreate indexes, to improve query performance.
- Load by total time/Load by CPU/Load by IO wait/Load by lock wait: The options by which you can filter specific queries to find the largest load.
- % load by Queries: The percentage load by individual query.
- Analyze latency: if you enabledAI-assisted troubleshooting (Preview) for this instance, then you can click this link to troubleshoot slow queries.
- Avg execution time (ms): the average time for the query to execute.
- Times called: the number of times the application called the query.
- Avg rows returned: the average number of rows returned for the query.
Query insights stores and displays only normalized queries.
By default, query insights doesn't collect IP addresses or tag information. Youcanenable query insights to collect this informationand, when required, disable collection.
Query plan traces don't collect or store any constant values and removes anyPII information that the constant might show.
For PostgreSQL 9.6 and 10, query insights displays normalized queries, that is,? replaces the literal constant value. In the following example, the nameconstant is removed and? replaces it.
UPDATE"demo_customer"SET"customer_id"=?::uuid,"name"=?,"address"=?,"rating"=?,"balance"=?,"current_city"=?,"current_location"=?WHERE"demo_customer"."id"=?
For PostgreSQL version 11 and later,$1,$2, andsimilar variables replace literal constant values.
UPDATE"demo_customer"SET"customer_id"=$1::uuid,"name"=$2,"address"=$3,"rating"=$4,"balance"=$5,"current_city"=$6,"current_location"=$7WHERE"demo_customer"."id"=$8
Filter by query tags
To troubleshoot an application, you mustfirstadd tags to your SQL queries.Query load tags provide a breakdown of the query load of the selected tag overtime.
Query insights provides application-centric monitoring to diagnose performanceproblems for applications built using ORMs. If you're responsible for the entireapplication stack, query insights provides query monitoring from an applicationview. Query tagging helps you find issues at higher-level constructs, such aswith the business logic or a microservice.
You might tag queries by the business logic, for example, the payment,inventory, business analytics, or shipping tags. You can then find the queryload that the various business logic create. For example, you might observeunexpected events, such as spikes for a business analytics tag at 1 PM orunexpected growth for a payment service trending over the previous week.
To calculate theDatabase load for tag, query insights uses the amountof time taken by every query that uses the tag that you select. The toolcalculates the completion time at the minute boundary by using wall-clock time.
On the query insights dashboard, to view the tags table, selectTags.The table sorts tags by their total load by total time.

You can sort the table by selecting a property fromFilter tags, or byclicking a column heading. The table shows the following properties:
- Action, Controller, Framework, Route, Application, DB driver: Each property that you added to your queries appears as a column. At least one of these properties must be added if you want to filter by tags.
- Load by total time/Load by CPU/Load by IO wait/Load by lock wait: Options to filter specific queries to find the largest load for each option.
- Avg execution time (ms): The average time for the query to run.
- Avg rows returned: The average number of rows returned for the query.
- Times called: The number of times the application called the query.
- Database: The database against which the query was run.
View query details for a specific query or tag
To determine whether a specific query or tag is the root cause of the problem,do the following from theQueries tab orTags tab, respectively:
- To sort the list in descending order, click theLoad by total time header.
- Click the query or tag at the top of the list. It has the highest load and is taking more time than the others.
TheQuery details page opens and shows the details of the selectedquery or tag.
Examine a specific query load
TheQuery details page for a selected query appears as follows:

TheDatabase load — specific query graph shows a measure of the work(in CPU seconds) that your normalized query has performed in yourselected query over time. To calculate load, it uses the amount of time taken bythe normalized queries that are completed at the minute boundary to thewall-clock time. At the top of the table, the first 1024 characters of thenormalized query, with literals removed for aggregation and PII reasons, aredisplayed.

As with the total queries graph, you can filter the load for a specific query byDatabase,User, andClient address. Query load is split intoCPUcapacity,CPU and CPU wait,IO wait, andLock wait.
Examine a specific tagged query load
The dashboard for a selected tag appears as follows. For example, if allqueries from a microservices payment are tagged aspayment, you cansee the amount of query load that's trending by viewing the tagpayment.

TheDatabase load — specific tags graph shows a measure ofthe work (in CPU seconds) that queries matching your selected tags haveperformed in your selected database over time. As with the total queries graph,you can filter the load for a specific tag byDatabase,User,andClient address.
Examine operations in a sampled query plan
Aquery plan takes asample of your query and breaks it down into individual operations. It explainsand analyzes each operation in the query.
TheQuery plan samples graph shows all the query plans running atparticular times and the amount of time each plan took to run. You can changethe rate at which query plan samples are captured per minute. SeeEnable Query Insights.

By default, the panel on the right shows the details for the sample query planthat takes the longest time, as visible on theQuery plan samples graph.To see the details for another sample query plan, click the relevant circle onthe graph. Expanded details show a model of all the operations in the query plan.
Each operation shows the latency, rows returned, and the cost of theoperation. When you select an operation, you can see more details, such asshared hit blocks, the type of schema, loops, and plan rows.

Try to narrow down the problem by looking into the following questions:
- What's the resource consumption?
- How does it relate to other queries?
- Does consumption change over time?
Examine a trace generated by a sample query
In addition to viewing thesample query plan, you can use query insightsto view an in-context, end-to-end application trace for a sample query. Thistrace can help you identify the source of a problematic query by displayingdatabase activity for a specific request. Also, log entries that the applicationsends to Cloud Logging during the request are linked to the trace, whichhelps you with your investigation.
To view the in-context trace, do the following:
- In theSample Query screen, click theEnd-to-end Trace tab. This tab displays a Gantt chart that details the spans, which are records of individual operations, for the trace generated by the query.
- To view more details about each span, such as attributes and metadata, select the span.
You can also view the trace in theTrace Explorer page. To do so,clickView in Cloud Trace. For details about how to use theTrace Explorer page to explore your trace data, seeFind and explore traces.
Examine latency
Latency is the time taken for the normalized query to complete, inwall-clock time. You use theLatency graph to examine latency on thequery or tag. The latency dashboard shows the 50th, 95th, and 99th percentilelatencies to find outlier behaviors.
The following image shows the database load graph at the 50th percentile for aspecific query with filters selected for CPU capacity, CPU and CPU wait,IO wait, and Lock wait.

The latency ofparallel queriesis measured in wall-clock time even though the query load can be higher for thequery due to multiple cores being used to run part of the query.
Try to narrow down the problem by looking into the following questions:
- What's causing the high load? Select options to look at the CPU capacity, CPU and CPU wait, I/O wait, or Lock wait.
- How long has the load been high? Is it only high now? Or has it been high for a long time? Change the time range to find the date and time that the load started performing poorly.
- Were there spikes in latency? Change the time window to study the historical latency for the normalized query.
Add tags to SQL queries
Tagging SQL queries simplifies application troubleshooting. You can usesqlcommenter to add tags toyour SQL queries either automatically or manually.
Use sqlcommenter with ORM
When you useORMinstead of directly writing SQL queries, you might not find application codethat's causing performance challenges. You might also have trouble analyzinghow your application code affects query performance. To tackle this issue, QueryInsights provides an open source library called sqlcommenter. Thislibrary is useful for developers and administrators using ORM tools todetect which application code is causing performance problems.
If you're using ORM and sqlcommenter together, the tags are automaticallycreated. You don't need to add or change code in your application.
You can install sqlcommenter on the application server. Theinstrumentation library allows application information related to your MVCframework to be propagated to the database along with the queries as a SQLcomment. The database picks up these tags and starts recording and aggregatingstatistics by tags, which are orthogonal to statistics aggregated bynormalized queries. Query insights shows the tags so that you know whichapplication is causing the query load and can find theapplication code that's causing performance problems.
When you examine results in SQL database logs, they appear as follows:
SELECT*fromUSERS/action='run+this',controller='foo%3',traceparent='00-01',tracestate='rojo%2'/
Supported tags include the controller name, route, framework, and action.
The set of ORM tools in sqlcommenter is supported for the following programminglanguages:
| Python |
|
| Java |
|
| Ruby |
|
| Node.js |
|
| PHP |
|
For more information about sqlcommenter and how to use it in your ORMframework, see thesqlcommenter documentation.
Use sqlcommenter to add tags
If you're not using ORM, you must manually add sqlcommenter tags or commentsin the correctSQL comment formatto your SQL query. You must also augment each SQL statement with a commentcontaining a serialized key-value pair. Use at least one of the following keys:
action=''controller=''framework=''route=''application=''db driver=''
Query insights drops all other keys.
Blocked active queries
If a specific active query is blocked or running much longer than expected, itcan block other dependent queries.
Cloud SQL gives you the option to terminate specific long-running orblocked active queries.
For more information, seeBlocked active queries.
Disable query insights
Note: When you disable query insights, Cloud SQL doesn't delete any data from disk.Console
To disable query insights for a Cloud SQL instance by using the Google Cloud console, follow these steps:
In the Google Cloud console, go to theCloud SQL Instances page.
- To open theOverview page of an instance, click the instance name.
- On theConfiguration tile, clickEdit configuration.
- In theConfiguration options section, expandQuery insights.
- Clear theEnable Query insights checkbox.
- ClickSave.
gcloud
To disable query insights for a Cloud SQL instance by usinggcloud, rungcloud sql instances patch with the--no-insights-config-query-insights-enabled flag as follows, after replacingINSTANCE_ID with the ID of the instance.
gcloudsqlinstancespatchINSTANCE_ID\--no-insights-config-query-insights-enabledREST
To disable query insights for a Cloud SQL instance by using the REST API, call theinstances.patch method withqueryInsightsEnabled set tofalse as follows.
Before using any of the request data, make the following replacements:
- project-id: The project ID.
- instance-id: The instance ID.
HTTP method and URL:
PATCH https://sqladmin.googleapis.com/sql/v1beta4/projects/project-id/instances/instance-id
Request JSON body:
{ "settings" : { "insightsConfig" : { "queryInsightsEnabled" : false } }}To send your request, expand one of these options:
curl (Linux, macOS, or Cloud Shell)
Note: The following command assumes that you have logged in to thegcloud CLI with your user account by runninggcloud init orgcloud auth login , or by usingCloud Shell, which automatically logs you into thegcloud CLI . You can check the currently active account by runninggcloud auth list. Save the request body in a file namedrequest.json, and execute the following command:
curl -X PATCH \
     -H "Authorization: Bearer $(gcloud auth print-access-token)" \
     -H "Content-Type: application/json; charset=utf-8" \
     -d @request.json \
     "https://sqladmin.googleapis.com/sql/v1beta4/projects/project-id/instances/instance-id"
PowerShell (Windows)
Note: The following command assumes that you have logged in to thegcloud CLI with your user account by runninggcloud init orgcloud auth login . You can check the currently active account by runninggcloud auth list. Save the request body in a file namedrequest.json, and execute the following command:
$cred = gcloud auth print-access-token
$headers = @{ "Authorization" = "Bearer $cred" }

Invoke-WebRequest `
    -Method PATCH `
    -Headers $headers `
    -ContentType: "application/json; charset=utf-8" `
    -InFile request.json `
    -Uri "https://sqladmin.googleapis.com/sql/v1beta4/projects/project-id/instances/instance-id" | Select-Object -Expand Content
You should receive a JSON response similar to the following:
{ "kind": "sql#operation", "targetLink": "https://sqladmin.googleapis.com/sql/v1beta4/projects/project-id/instances/instance-id", "status": "PENDING", "user": "user@example.com", "insertTime": "2021-01-28T22:43:40.009Z", "operationType": "UPDATE", "name": "operation-id", "targetId": "instance-id", "selfLink": "https://sqladmin.googleapis.com/sql/v1beta4/projects/project-id/operations/operation-id", "targetProject": "project-id"}Disable query insights for Cloud SQL Enterprise Plus edition
To disable query insights for Cloud SQL Enterprise Plus edition, do the following:
In the Google Cloud console, go to theCloud SQL Instances page.
- To open theOverview page of an instance, click the instance name.
- ClickEdit.
- In theCustomize your instance section, expandQuery insights.
- Clear theEnable Enterprise Plus features checkbox.
- ClickSave.
What's next
- Launch blog:Solve database bottlenecks faster with the latest query insights for Cloud SQL Enterprise Plus edition
- SeeCloud SQL metrics. The query insights metric type strings start with
database/postgresql/insights. - Blog:Boost your query performance troubleshooting skills with Cloud SQL Insights
- Video:Introducing Cloud SQL Insights
- Podcast:Cloud SQL Insights
- Insights Codelab
- Optimize high CPU usage
- Optimize high memory usage
- Blog:Introducing Sqlcommenter: An open source ORM auto-instrumentation library
- Blog:Enable query tagging with Sqlcommenter
Except as otherwise noted, the content of this page is licensed under theCreative Commons Attribution 4.0 License, and code samples are licensed under theApache 2.0 License. For details, see theGoogle Developers Site Policies. Java is a registered trademark of Oracle and/or its affiliates.
Last updated 2025-11-24 UTC.