

Analyze query performance
This page describes how to use the Query insights dashboard todetect and analyze Spanner performance problems.
Query insights overview
Query insights helps you detect and diagnose query andDML (INSERT,UPDATE, andDELETE) statementperformance problems for a Spanner database. It supportsintuitive monitoring and provides diagnostic information that helps you gobeyond detection to identify the root cause of performance problems.
Query insights helps you improve Spanner queryperformance by guiding you through the following steps:
- Determine whether inefficient queries are causing high CPU utilization.
- Identify a potentially problematic query or tag.
- Analyze the query or request tag to identify issues.
Query insights is available in single-region and multi-regionconfigurations.
Pricing
There is no additional cost for Query insights.
Data retention
Query insights retains data for a maximum of 30 days.For theTotal CPU Utilization (per Query or Request tag) graph, Spanner retrieves data from theSPANNER_SYS.QUERY_STATS_TOP_* tables. These tableshave a maximumretention of 30 days. SeeData retentionto learn more.
Required roles
You need different IAM roles and permissions depending on whether you are an IAM user or a fine-grained access control user.
Identity and Access Management (IAM) user
To get the permissions that you need to view Query insights page, ask your administrator to grant you the following IAM roles on the instance:
- Cloud Spanner Viewer (
roles/spanner.viewer) - Cloud Spanner Database Reader (
roles/spanner.databaseReader)
roles/spanner.databaseReader)role are required to view the Query insights page:spanner.databases.beginReadOnlyTransactionspanner.databases.selectspanner.sessions.create
Fine-grained access control user
If you are a fine-grained access control user, verify that you:
- Have theCloud Spanner Viewer(
roles/spanner.viewer) - Have fine-grained access control privileges and are granted the
spanner_sys_readersystem role or one of its member roles. - Select the
spanner_sys_readeror a member role as your current system roleon the database overview page.
spanner.databases.select, the Google Cloud console assumes you are an IAM user. You cannot select thespanner_sys_reader or a member role on the database overview page as an IAM user.For more information, seeAbout fine-grained access control andFine-grained access control system roles.
The Query insights dashboard
The Query insights dashboard shows thequery load based on thedatabase and time range that you select. Query load is a measurement of thetotal CPU utilization for all the queries in the instance in the selected timerange. The dashboard provides a series of filters that help you view the queryload.
To view the Query insights dashboard for a database, do the following:
- SelectQuery insights in the left navigation panel. TheQuery insights dashboard opens.
- Select a database from theDatabases list. The dashboardshows the query load information for the database.
The areas of the dashboard include:
- Databases list: Filters the query load on a specific database or alldatabases.
- Time range filter: Filters the query load by time ranges, such as hours,days, or a custom range.
- Total CPU Utilization (All queries) graph: Displays the aggregated loadof all queries.
- Total CPU Utilization (per Query or Request tag) graph: Displays the CPUutilization by each query or request tag.
- TopN queries and tags table: Displays the list of top queries and requesttags sorted by CPU utilization. SeeIdentify a potentially problematic query or tag.

Dashboard performance
Usequery parameters ortag your queriesto optimize Query insights performance. If you don't parameterizeor tag your queries, then too many results might return, which might causethe TopN queries and tags table to not load properly.
Confirm if inefficient queries are responsible for high CPU utilization
Total CPU Utilization is a measure of the work (in CPU seconds) that theexecuted queries in your selected database perform over time.

Review the graph to explore these questions:
Which database is experiencing the load? Select different databases fromthe Databases list to find the databases with the highest loads.To find out which database has the highest load, you can also review theCPU utilization - total chart for databases in theGoogle Cloud console.
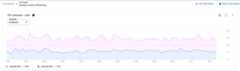
Is the CPU utilization high? Is the graphspiking or elevated over time? If you don't see high CPU utilization, thenthe problem isn't with your queries.
How long has the CPU utilization been high? Did it spike recently or hasit consistently been high for some time? Use the range selector to selectvarious time periods to find out how long the problem has lasted. Zoom in toview a time window where the query load spikes are observed. Zoom out toview up to one week of the timeline.
If you see a spike or an elevation in the graph corresponding to the overallinstance CPU usage, then it is most likely due to one or more expensive queries.Next, you can dive deeper into the debugging journey by identifying apotentially problematic query or request tag.
Identify a potentially problematic query or request tag
To identify a potentially problematic query or request tag, observe the TopNqueries section:
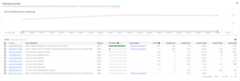
Here we see that the query with the fingerprint3216067328234137024 has a highCPU utilization and can be problematic.
TheTopN queries table provides an overview of the queries that use themost CPU during the chosen time window, sorted from highest to lowest. Thenumber of TopN queries are limited to 100.
For the graphs, we fetch the data from the TopN query statistics table, whichhas three different granularities: 1 min, 10 min, and 1 hour. The value for eachdata point in the graphs represents the average value over an interval of oneminute.
We recommend that youadd tags to your SQL queries.Query tagging helps you find issues at higher-level constructs, such as with thebusiness logic or a microservice.

The table shows the following properties:
- Fingerprint: Hash of the request tag, or if the tag isn't present, ahash of the query text.
Query or Request tag: If the query has a tag associated along with it, theRequest tag is shown. Statistics for multiple queries that have the same tagstring are grouped in a single row with the
REQUEST_TAGvalue matching thetag string. To learn more about using request tags, seeTroubleshooting with request tags and transaction tags.If the query does not have an associated tag, the SQL query, truncated toapproximately 64KB, is shown. For batch DML, the SQL statements are flattenedinto a single row and concatenated, using a semicolon delimiter. Consecutiveidentical SQL texts are deduplicated before truncating.
Query type: Indicates if a query is a
PARTITIONED_QUERYorQUERY.APARTITIONED_QUERYis a query with apartitionTokenobtained from thePartitionQuery API.All the other queries and DML statements are denoted by theQUERYquerytype.CPU Utilization: CPU resource consumption by a query, as a percentage ofthe total CPU resources used by all the queries running on the databases inthat time interval, shown on a horizontal bar having a range of 0 to 100.
Recommendation: Spanner analyzes your queries to determineif they can benefit from improved indexes. If so, it recommends new or alteredindexes that can improve the query performance. For more information, seeUse the Spanner index advisor.
CPU (%): CPU resource consumption by a query, as a percentage of thetotal CPU resources used by all the queries running on the databases in thattime interval.
Execution count: Number of times Spanner saw the queryduring the interval.
Avg latency (ms): Average length of time, in microseconds, for each queryexecution within the database. This average excludes the encoding andtransmission time for the result set as well as overhead.
Avg rows scanned: Average number of rows that the query scanned, excludingdeleted values.
Avg rows returned: Average number of rows that the query returned.
Bytes returned: Number of data bytes that the query returned, excludingtransmission encoding overhead.
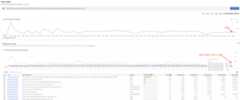
Possible variance between the graphs
You might notice some variance between theTotal CPU Utilization (all queries) graph and theTotal CPU Utilization (per Query or Request tag) graph. There are two thingsthat could lead to this scenario:
Different sources of data: The Cloud Monitoring data, which feeds theTotal CPU Utilization (all queries) graph, is usually more accurate becauseit's pushed every minute and has a retention period of 45 days. On the otherhand, the system table data, which feeds the Total CPU Utilization (per Queryor Request tag) graph might be averaged over 10 mins (or 1 hour) in which casewe might lose high granularity data we see in the Total CPU Utilization(all queries) graph.
Different aggregation windows: Both graphs have different aggregationwindows. For example, when inspecting an event older than 6 hours, we wouldquery the
SPANNER_SYS.QUERY_STATS_TOTAL_10MINUTEtable. In this case, anevent that occurs at 10:01 would get aggregated over 10 minutes and would bepresent in the system table corresponding to the 10:10 timestamp.
The following screenshot shows an example of such variance.
Analyze a specific query or request tag
To determine if a query or request tag is the root cause of the problem, clickthe query or request tag that looks like it has the highest load or istaking a longer time than the others. You can select multiple queries andrequest tags at a time.
You can hold the mouse pointer on the graph for queries across the timeline toknow their CPU utilization (in seconds).
Try to narrow down the problem by looking at the following:
- How long has the load been high? Is it only high now? Or has it been highfor a long time? Change the time ranges to find the date and time where thequery started performing poorly.
- Were there spikes in CPU utilization? You can change the time window tostudy the historical CPU utilization for the query.
- What is the resource consumption? How does it relate to other queries?Look at the table and compare the data of other queries with the selected one.Is there a major difference?
To confirm that the selected query is contributing to the high CPU Utilization,you can drill down into the details of the specific query shape (or request tag)and analyze it further on the Query Details page.
View the Query Details page
To view the details of a specific query shape or request tag in a graphicalform, click the fingerprint associated with the query or request tag.The Query Details page opens.

The Query Details page shows the following information:
- Query details text: SQL query text, truncated to approximately 64KB.Statistics for multiple queries that have the same tag string are grouped ina single row with the REQUEST_TAG matching that tag string. Only the text ofone of those queries is shown in this field. For batch DML, the set of SQLstatements are flattened into a single row, concatenated using a semicolondelimiter. Consecutive identical SQL texts are deduplicated beforetruncating.
- The values of the following fields:
- Execution count: Number of times Spanner saw the queryduring the interval.
- Avg. CPU (ms): Average CPU resource consumption, in milliseconds, by aquery of the instance's CPU resources in a time interval.
- Avg. Latency (ms): Average length of time, in milliseconds, for eachquery execution within the database. This average excludes the encodingand transmission time for the result set and overhead.
- Avg. rows returned: Average number of rows that the query returned.
- Avg. rows scanned: Average number of rows that the query scanned,excluding deleted values.
- Avg. bytes: Number of data bytes that the query returned, excludingtransmission encoding overhead.
- Query plans samples graph: Each dot on the graph represents a sampledquery plan at a specific time and its specific query latency. Click one ofthe dots in the graph to view the query plan and visualize the steps takenduring the query execution.Note: Query plans are not supported for queries withpartitionTokens obtained from the PartitionQuery API andPartitioned DML queries.
Query plan visualizer: Shows the sampled query plan selected.Spanner provides the following layout options:
- Tree View: The tree view visualizes the query plan as a graph whereeach node or card represents an iterator that consumes rows from itsinputs and produces rows to its parent. You can click each iterator forexpanded information.
Sequential View: The sequential view visualizes the query plan in ahierarchical table where each row represents an operator. You can clickeach row for expanded information.
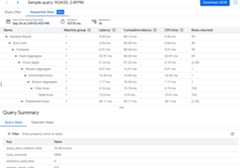
The table shows the following columns:
- Name: The name of the operator.
- Machine group: The machine group where this operator executed.
- Latency: The amount of time elapsed during the execution of thecurrent operation. This might be more than the CPU time (for example,if the operator waited on remote calls or file system delay).
- Cumulative latency: The amount of time elapsed during theexecution of the entire subtree rooted at this operator. This doesn'tinclude plan creation time and other overhead, so the cumulativelatency might be shorter than the total duration of the query.
- CPU Time: Total amount of CPU time spent executing the query.Excludes network latency. Some parts of query execution might proceedin parallel, so it's possible for CPU time to be longer than totalelapsed time. For example, if a query executes ten parallel operationsin 1 millisecond (ms), the elapsed time is 1 ms, but the CPU time is10 ms.
- Rows returned: The number of rows returned by the operator.
Query latency graph: Shows the value of query latency for a selectedquery over a time period. It also shows the average latency.
CPU Utilization graph: Shows the CPU utilization by a query,in percentage, over a time period. It also shows the average CPUutilization.
Execution count/failed graph: Shows the execution count of aquery over a time period and the number of times the query execution failed.
Rows scanned graph: Shows the number of rows thatthe query scanned over a time period.
Rows returned graph: Shows the number of rows thatthe query returned over a time period.
Time range filter: Filters query details by time ranges, such as hour,day, or a custom range.
For the graphs, we fetch the data from the TopN query statistics table, whichhas three different granularities: 1 min, 10 min, and 1 hour. The value for eachdata point in the graphs represents the average value over an interval of oneminute.
Search for all executions of a query in the audit log
To search for all executions of a particular query fingerprint inCloud Audit Logs,query the audit log and search for anyquery_fingerprint matching theFingerprint field in the TopN query statisticstable. For more information, see theQuery and view logs overview. Use this method to identify the user who initiated the query.
What's next
Except as otherwise noted, the content of this page is licensed under theCreative Commons Attribution 4.0 License, and code samples are licensed under theApache 2.0 License. For details, see theGoogle Developers Site Policies. Java is a registered trademark of Oracle and/or its affiliates.
Last updated 2026-02-19 UTC.