Monitor startup latency metrics
This page describes the metrics and dashboards available for monitoring startuplatency of Google Kubernetes Engine (GKE) workloads and the underlying clusternodes. You can use the metrics to track, troubleshoot, and reduce startuplatency.
This page is for Platform admins and operators who need to monitor and optimizestartup latency of their workloads. To learn more about common roles that wereference in Google Cloud content, seeCommon GKEuser roles and tasks.
Overview
Startup latency significantly impacts how your application responds to trafficspikes, how quickly its replicas recover from disruptions, and how efficient theoperating costs of your clusters and workloads can be. Monitoring the startuplatency of your workloads can help you detect latency degradations and track theimpact of workload and infrastructure updates on the startup latency.
Optimizing workload startup latency has the following benefits:
- Lowers the response latency of your service to users during traffic spikes.
- Reduces the excess serving capacity that's needed to absorb demand spikes while new replicas are created.
- Reduces the idle time of resources that are already deployed and waiting for theremaining resources to start up during batch computations.
Before you begin
Before you start, make sure that you have performed the following tasks:
- Enable the Google Kubernetes Engine API. Enable Google Kubernetes Engine API
- If you want to use the Google Cloud CLI for this task,install and theninitialize the gcloud CLI. If you previously installed the gcloud CLI, get the latest version by running the
gcloud components updatecommand. Earlier gcloud CLI versions might not support running the commands in this document.Note: For existing gcloud CLI installations, make sure to set thecompute/regionproperty. If you use primarily zonal clusters, set thecompute/zoneinstead. By setting a default location, you can avoid errors in the gcloud CLI like the following:One of [--zone, --region] must be supplied: Please specify location. You might need to specify the location in certain commands if the location of your cluster differs from the default that you set.
Enable the Cloud Logging and Cloud Monitoring APIs.
Roles required to enable APIs
To enable APIs, you need the Service Usage Admin IAM role (
roles/serviceusage.serviceUsageAdmin), which contains theserviceusage.services.enablepermission.Learn how to grant roles.
Requirements
To view metrics and dashboards for startup latency of workloads, your GKE cluster must meet thefollowing requirements:
- You must have GKE version 1.31.1-gke.1678000 or later.
- You must configure collection ofsystem metrics.
- You must configure collection ofsystem logs.
- Enablekube state metrics withthe
PODcomponent on your clusters to view the Pod and container metrics.
Required roles and permissions
To get the permissions that you need to enable log generation and to access and process logs, ask your administrator to grant you the following IAM roles:
- View GKE clusters, nodes and workloads:Kubernetes Engine Viewer (
roles/container.viewer) on your project - Access startup latency metrics and view the dashboards:Monitoring Viewer (
roles/monitoring.viewer) on your project - Access logs with latency information, such as Kubelet image pull events, and view them in Logs Explorer and Log Analytics:Logs Viewer (
roles/logging.viewer) on your project
For more information about granting roles, seeManage access to projects, folders, and organizations.
You might also be able to get the required permissions throughcustom roles or otherpredefined roles.
Startup latency metrics
Startup latency metrics are included inGKE system metrics and areexported to Cloud Monitoring in the same project as theGKE cluster.
The Cloud Monitoring metric names in this table must be prefixed withkubernetes.io/. That prefix has been omitted from theentries in the table.
| Metric type (Resource hierarchy levels) Display name | |
|---|---|
| Kind, Type, Unit Monitored resources | Description Labels |
pod/latencies/pod_first_ready (project)Pod first ready latency | |
GAUGE, Double, sk8s_pod | The Pod end-to-end startup latency (from PodCreated toReady), including image pulls. Sampled every 60 seconds. |
node/latencies/startup (project)Node startup latency | |
GAUGE, INT64, sk8s_node | The total startup latency of the node, from GCE instance'sCreationTimestamp toKubernetes node ready for the first time. Sampled every 60 seconds.accelerator_family: a classification of nodes based on hardware accelerators:gpu,tpu,cpu.kube_control_plane_available: whether the node creation request was received when KCP (kube control plane) was available. |
autoscaler/latencies/per_hpa_recommendation_scale_latency_seconds (project)Per HPA recommendation scale latency | |
GAUGE, DOUBLE, sk8s_scale | Horizontal Pod Autoscaler (HPA) scaling recommendation latency (time between metrics being created and corresponding scaling recommendation being applied to the apiserver) for the HPA target. Sampled every 60 seconds. After sampling, data is not visible for up to 20 seconds.metric_type: the type of metric source. It should be one of"ContainerResource","External","Object","Pods" or"Resource". |
View the Startup Latency dashboard for workloads
TheStartup Latency dashboard for workloads is only available forDeployments. To view startup latency metrics for Deployments, perform thefollowing steps in the Google Cloud console:
Go to theWorkloads page.
To open theDeployment details view, click the name of the workload thatyou want to inspect.
Click theObservability tab.
SelectStartup Latency from the menu on the left.
View startup latency distribution of Pods
The startup latency of Pods refers to the total startup latency, including imagepulls, which measures the time from theCreated status of the Pod until theReady status. You can assess the startup latency of Pods by using thefollowing two charts:
Pod Startup Latency Distribution chart: this chart shows the startuplatency percentiles of Pods (fiftieth percentile, ninety-fifth percentile, andninety-ninth percentile) that are calculated based on the observations of Podstartup events over fixed 3-hour time intervals, for example, 12:00 AM-3:00 AMand 3:00 AM-6:00 AM. You can use this chart for the following purposes:
- Understand your baseline Pod startup latency.
- Identify changes in Pod startup latency over time.
- Correlate changes in Pod startup latency with recent events, such as WorkloadDeployments or Cluster Autoscaler events. You can select the events in theAnnotations list at the top of the dashboard.

Pod Startup Count chart: this chart shows the count of Pods that were startedduring the selected time intervals. You can use this chart for the followingpurposes:
- Understand the Pod sample sizes that are used to calculate the percentilesof Pod startup latency distribution for a given time interval.
- Understand the causes of Pod starts, such as Workload Deployments or Horizontal PodAutoscaler events. You can select the events in theAnnotations list atthe top of the dashboard.

View startup latency of individual Pods
You can view the startup latency of individual Pods on thePod First ReadyLatency timeline chart and the associated list.
- Use thePod First Ready Latency timeline chart to correlate individual Podstarts with recent events, such as Horizontal Pod Autoscaler or ClusterAutoscaler events. You can select these events in theAnnotations list atthe top of the dashboard. This chart helps you determine potential causes forany changes in startup latency compared to other Pods.
- Use thePod First Ready Latency list to identify individual Pods that tookthe most or the least time to start. You can sort the list by theLatency column. When you identify Pods that have the highest startup latency,you can troubleshoot latency degradation by correlating the Pod start eventswith other recent events.

You can find out when an individual Pod was created by looking at the value inthetimestamp field in a corresponding Pod creation event. To see thetimestamp field, run the following query inLogs Explorer:
log_id("cloudaudit.googleapis.com/activity")ANDprotoPayload.methodName="io.k8s.core.v1.pods.create"ANDresource.labels.project_id=PROJECT_IDANDresource.labels.cluster_name=CLUSTER_NAMEANDresource.labels.location=CLUSTER_LOCATIONANDprotoPayload.response.metadata.namespace=NAMESPACEANDprotoPayload.response.metadata.name=POD_NAMETo list all Pod creation events for your workload, use the following filter in the preceding query:protoPayload.response.metadata.name=~"POD_NAME_PREFIX-[a-f0-9]{7,10}-[a-z0-9]{5}"
When you compare the latencies of individual Pods, you can test the impact ofvarious configurations on Pod startup latency and identify an optimalconfiguration based on your requirements.
Determine Pod scheduling latency
Pod scheduling latency is the amount of time between when a Pod was created andwhen the Pod was scheduled on a node. Pod scheduling latency contributes to a Pod's end-to-end startuptime, and is calculated by subtracting the timestamps of a Pod scheduling eventand a Pod creation request.
You can find a timestamp of an individual Pod scheduling event from thejsonPayload.eventTime field in a corresponding Pod scheduling event. To seethejsonPayload.eventTime field, run the following query inLogs Explorer:
log_id("events")jsonPayload.reason="Scheduled"resource.type="k8s_pod"resource.labels.project_id=PROJECT_IDresource.labels.location=CLUSTER_LOCATIONresource.labels.cluster_name=CLUSTER_NAMEresource.labels.namespace_name=NAMESPACEresource.labels.pod_name=POD_NAMETo list all Pod scheduling events for your workload, use the following filter in the preceding query:resource.labels.pod_name=~"POD_NAME_PREFIX-[a-f0-9]{7,10}-[a-z0-9]{5}"
View image pull latency
Container image pull latency contributes to Pod startup latency in scenarioswhen the image is not yet available on the node or the image needs to berefreshed. When you optimize image pull latency, you reduce your workloadstartup latency during cluster scale-out events.
You can view theKubelet Image Pull Events table to see when the workloadcontainer images were pulled and how long the process took.

The image pull latency is available in thejsonPayload.message field, whichcontains a message like the following:
"Successfully pulled image "gcr.io/example-project/image-name" in 17.093s (33.051s including waiting). Image size: 206980012 bytes."View the latency distribution of HPA scaling recommendations
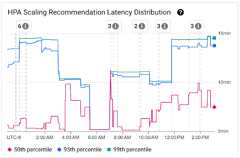
The latency of Horizontal Pod Autoscaler (HPA) scaling recommendations for the HPAtarget is the amount of time between when the metrics are created and when thecorresponding scaling recommendation is applied to the API server. When youoptimize HPA scaling recommendation latency, you reduce your workload startuplatency during scale-out events.
HPA scaling can be viewed on the following two charts:
HPA Scaling Recommendation Latency Distribution chart: this chart showsthe percentiles of HPA scaling recommendation latency (fiftieth percentile, ninety-fifthpercentile, and ninety-ninth percentile) that are calculated based on the observationsof HPA scaling recommendations over trailing 3-hour time intervals. You canuse this chart for the following purposes:
- Understand your baseline HPA scaling recommendation latency.
- Identify changes in HPA scaling recommendation latency over time.
- Correlate changes in HPA scaling recommendation latency with recent events.You can select the events in theAnnotations list at the top of thedashboard.
HPA Scaling Recommendation Count chart: this chart shows the count of HPAscaling recommendations that were observed during the selected time interval. Use thechart for the following tasks:
- Understand the HPA scaling recommendation sample sizes. The samples are usedto calculate the percentiles in the distribution of latency for HPA scalingrecommendations for a given time interval.
- Correlate HPA scaling recommendations with new Pod startup events and withHorizontal Pod Autoscaler events. You can select the events in theAnnotations list at the top of the dashboard.

View scheduling issues for Pods
Pod scheduling issues might impact the end-to-end startup latency of yourworkload. To reduce the end-to-end startup latency of your workload,troubleshoot and reduce the number of these issues.
The following are the two charts available for tracking such issues:
- TheUnschedulable/Pending/Failed Pods chart shows the counts ofunschedulable, pending, and failed Pods over time.
- TheBackoff/Waiting/Readiness Failed Containers chart shows the counts ofcontainers in these states over time.
View startup latency dashboard for nodes
To view startup latency metrics for nodes, perform the following steps in theGoogle Cloud console:
Go to theKubernetes Clusters page.
To open theCluster details view, click the name of the cluster that youwant to inspect.
Click theObservability tab.
From the menu on the left, selectStartup Latency.
View distribution of startup latency of nodes
The startup latency of a node refers to the total startup latency, whichmeasures the time from theCreationTimestamp of the node until theKubernetes node ready status. Node startup latency can be viewed on thefollowing two charts:
Node Startup Latency Distribution chart: this chart shows the percentilesof node startup latency (fiftieth percentile, ninety-fifthpercentile, and ninety-ninth percentile) that are calculated based on the observations of node startupevents over fixed 3-hour time intervals, for example, 12:00 AM-3:00 AM and3:00 AM-6:00 AM. You can use this chart for the following purposes:
- Understand your baseline node startup latency.
- Identify changes in node startup latency over time.
- Correlate changes in node startup latency with recent events, such asCluster Updates or Node Pool Updates. You can select the events in theAnnotations list at the top of the dashboard.

Node Startup Count chart: this chart shows the count of nodes startedduring the selected time intervals. You can use the chart for the followingpurposes:
- Understand the node sample sizes, used to calculate the node startuplatency distribution percentiles for a given time interval.
- Understand the causes of node starts such as Node Pool Updates or ClusterAutoscaler events. You can select the events in theAnnotations list at thetop of the dashboard.

View startup latency of individual nodes
When you compare the latencies of individual nodes, you can test the impact ofvarious node configurations on the node startup latency and identify an optimalconfiguration based on your requirements. You can view the startup latency ofindividual nodes on theNode Startup Latency timeline chart and theassociated list.
Use theNode Startup Latency timeline chart to correlate individual nodestarts with recent events, such as Cluster Updates or Node Pool Updates. Youcan determine potential causes for changes in startup latency compared toother nodes. You can select the events in theAnnotations list at the topof the dashboard.
Use theNode Startup Latency list to identify individual nodes that tookthe most or the least time to start. You can sort the list by theLatency column. When you identify nodes with the highest startup latency,you can troubleshoot latency degradation by correlating node start events withother recent events.

You can find out when an individual node was created by looking at the value of theprotoPayload.metadata.creationTimestamp field in a corresponding node creationevent. To see theprotoPayload.metadata.creationTimestamp field, run thefollowing query inLogs Explorer:
log_id("cloudaudit.googleapis.com/activity")ANDprotoPayload.methodName="io.k8s.core.v1.nodes.create"ANDresource.labels.project_id=PROJECT_IDANDresource.labels.cluster_name=CLUSTER_NAMEANDresource.labels.location=CLUSTER_LOCATIONANDprotoPayload.response.metadata.name=NODE_NAMEView startup latency in a node pool
If your node pools have different configurations, for example, to run differentworkloads, you might need to monitor node startup latency separately by nodepools. When you compare node startup latencies across your node pools, you canget insights into how node configuration impacts node startup latency andconsequently optimize latency.
By default, theNode Startup Latency dashboard shows the aggregated StartupLatency Distribution and individual Node Startup Latencies across all node poolsin a cluster. To view node startup latency for a specific node pool, select thename of the node pool by using the$node_pool_name_var filter located at thetop of the dashboard.
What's next
- Learn how tooptimize Pod autoscaling based on metrics.
- Learn more aboutways to reduce cold start latency on GKE.
- Learn how to reduce image pull latency withImage streaming.
- Learn aboutthe surprising economics of Horizontal Pod Autoscaling tuning.
- Monitor your workloads withautomatic application monitoring.
Except as otherwise noted, the content of this page is licensed under theCreative Commons Attribution 4.0 License, and code samples are licensed under theApache 2.0 License. For details, see theGoogle Developers Site Policies. Java is a registered trademark of Oracle and/or its affiliates.
Last updated 2025-11-06 UTC.