

Debug Kubernetes applications in Cloud Code for Cloud Shell
Cloud Code lets you debug an application deployed to aGoogle Kubernetes Engine (GKE) cluster by leveragingskaffold debug.
You can debug your application on a local cluster (likeminikube orDocker Desktop),GKE, or any other cloud provider.
With Cloud Code's debugging support, you don't have to completemanual setup like setting up port forwarding or injecting language-specificdebug arguments. Debugging requires a Cloud Code-readyGKE application that includes askaffold.yamlconfiguration file and acloudcode.kubernetes launch configuration.
Debug a GKE application
To begin debugging your GKE application, follow thesesteps:
In the Cloud Code status bar, click the active project name.

In the Quick Pick menu that appears, selectDebug on Kubernetes.
If your application doesn't have the necessarySkaffold configuration or
cloudcode.kuberneteslaunch configuration, Cloud Codehelps you set these up.Confirm whether to use the currentKubernetes contextto run the app in (or switch to a preferred one).
If you chose a remote cluster as the context, when prompted, choose an imageregistry to push the images to.
If your project hasArtifact Registry API enabled and at leastoneArtifact Registry repository, youcan browse to and select an existing Artifact Registry repository.
The following samples demonstrate how to specify where container images arestored for some common registries:
Artifact Registry REGION-docker.pkg.dev/PROJECT_ID/REPO_NAMEDocker Hub docker.io/ ACCOUNT
Make sure that you'reproperly authenticated if you're using a private Docker Hub repository.To generate the final image repository name, Cloud Codeconcatenates this image registry with the image name specified in theKubernetes manifests. This choice is stored in your
cloudcode.kuberneteslaunch configuration (found in.vscode/launch.json).For more information, see theimage registry handling guide.
Cloud Code builds your containers, pushes themto the registry, applies Kubernetes configurations to the cluster, and waitsfor the rollout.
After the rollout, Cloud Code automatically port-forwards alldeclared container ports to your machine and displays the URLs in the outputwindow so that you can browse your live application.
For each debuggable container in your application, confirm or enter thedirectory in the remote container where the program you want to debug islocated.
Alternatively, you can pressESC to skip debugging the container.

Cloud Code attaches a debug session for each debuggablecontainer in the application.
You can now perform the same tasks you normally do when debugging local code,like setting breakpoints and stepping through code, against a live Kubernetescluster.
By default, when a change to your application is autosaved,Cloud Code redeploys your application and sets up a new debugsession. You can toggle this feature with the
watchflag in your project'slaunch configuration.To inspect variables and stack info, use theDebug Sidebar.To interact with the debugging session, use theDebug Consolein the bottom pane debugger.
After your session completes, you can use the following contextual menucommands:
- Open Deployment Logs: Open the application logs of a specificdeployment with the Cloud Code logs explorer.
- Open Service URL: Open the application service URL of a specificservice in a web browser
If you've turned off watch mode in your launch configuration and you want tomake changes to your application and rebuild and redeploy the application,in the Development sessions pane, pause on the run action and then click
 Rebuild and redeploy the application.
To end the debugging session, click
 Stop in the Debug Toolbar.
After you end the debugging session, all the deployed Kubernetes resourcesare deleted from the cluster.
Configuration details
Note: Cloud Code doesn't modify your local Kubernetesconfigurations. The transformations happen at deploy-time and are visibleonly on the server.Cloud Code, powered bySkaffold, automaticallyhandles the following configuration details for all supported languages:
- Port forwarding the debug port so that the debugger can be attached.
- Attaching a debugger to one or more debuggable containers in your application.If your application has multiple debuggable containers (containers whoselanguage is supported by Cloud Code debug) configured in
skaffold.yaml, then a debugger is attached to each debuggable container. - Persisting source mapping definitions across sessions; you can customize thesedefinitions by editing your
.vscode/launch.jsonfile directly.
Cloud Code also handles the following language-specificconfiguration details:
Node.js
Rewriting the entrypoint to invoke:
node--inspect=localhost:9229Python
Installing theptvsd moduleusing an Init Container and rewriting the entrypoint to invoke:
python-mptvsd--hostlocalhost--port5678Go
Installing thedlv debuggerusing an Init Container and rewriting the entrypoint such that the launcheddebug session runs with a debug server only (in headless mode), continues thedebugged process on start, accepts multiple client connections, and listens atlocalhost:56268:
dlvexec--headless--continue--accept-multiclient--listen=localhost:56268--api-version=2,<app>--Java
Adding an environmentJAVA_TOOLS_OPTIONS with the appropriate Java DebugWire Protocol (JDWP) configuration such that the JDWP debugging agent listensfor a socket connection on port 5005 and allows the VM to begin executingbefore the debugger is attached:
jdwp=transport=dt_socket,server=y,suspend=n,address=5005,quiet=yFor more details on Skaffold-powered debugging, see theskaffold debug documentation.
Set up your container
To prepare your container for debugging, follow the instructions for thelanguage you're using:
Node.js
- Start the Node.js application with
--inspect=<debugPort>wheredebugPortcomes from theattach configuration.For example:CMD ["node", "--inspect=9229", "index.js"]
Python
- Make sure that you have the
ptvsdmoduleinstalled on your machine and in your container. - Start the Python application through
ptvsd. Match the port specified tothedebugPortfield in theattach configuration.For example:CMD["python","-m","ptvsd","--port","
" ,"app.py"]
Go
- Make sure that you have the
dlvpackageinstalled on your machine and your Go container. Start your Go application through
dlv debug.The port specified in the starting command should be the same as the
debugPortattribute value in theattach configuration.For example:CMD["dlv","debug","--headless","--listen=:<debugPort>","--log"]
Troubleshooting Tip: When debugging a Go application, the applicationwill stop and wait for a debugger to attach. Attach a debugger for theservice to start.
Java
- Make sure that JVM is installed on your machine.
Start the Java application with the following options, where
debugPortcomes from theattach configuration.-agentlib:jdwp=transport=dt_socket,server=y,suspend=n,address=
,quiet=y For example, to start the Java application in debug mode andlisten on port
debugPortfor connection:ENTRYPOINT["java","-agentlib:jdwp=transport=dt_socket,server=y,suspend=n,address=<debugPort>,quiet=y","-jar","my-app-1.0.jar"]
.NET Core
Make sure that you have the
vsdbg, the .NET Corecommand line debugger from Microsoft, installed on yourKubernetes container.For example:
RUNapt-getupdate
  &&apt-getinstall-y--no-install-recommendsunzip
  &&apt-getinstall-yprocps
  &&rm-rf/var/lib/apt/lists/*
  &&curl-sSLhttps://aka.ms/getvsdbgsh|bash/dev/stdin-vlatest-l/dbg/netcore/vsdbg
Set up your attach configuration
To attach to a debuggable container, you need to have anattach configurationof typecloudcode.kubernetes.
Add a .vscode/launch.json file
If your project doesn't have alaunch.json file in its.vscodefolder, you can add one using the Debug panel.
To navigate to the Debug panel, click
 Debugin the Activity bar.
SelectAdd Configuration from the drop-down menu.
SelectCloud Code: Kubernetes as the environment.
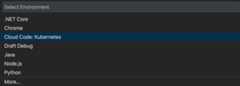
Select theAttach to Kubernetes Pod option.

Select the programming language you're using.
This creates and opens a
launch.jsonfile for your project and creates anattach configuration for you.Update configuration attributes in the
launch.jsonfile to match those ofyour project. For more information on configuration attributes, seeConfiguration attributes.
Add an attach configuration to your .vscode/launch.json file
To add a new attach configuration to an existing.vscode/launch.json file:
- Open the
launch.jsonfile. - To invoke the snippet Intellisense, clickAdd Configuration.
- To add an attach configuration, select theCloud Code: Attach to Kubernetes Pod snippet for the language you'reusing.
- Update attributes in the configuration to match those of yourproject. For more information on configuration attributes, seeConfiguration attributes.
Configuration attributes
| Attribute | Description |
|---|---|
| debugPort | Debug port used on the container. |
| podSelector | Set of key-value pairs used to select the debug pod. For more information, see theguide on selectors). The following sample shows a typicalpodSelector: "podSelector": { "app": <deployment-name> } |
| localRoot | Path to the local directory containing the program being debugged. Defaults to ${workspaceFolder}. |
| remoteRoot | Absolute path to the remote directory containing the program being debugged (on the Kubernetes container). |
Attach a debugger to your Kubernetes pod
Cloud Code for Cloud Shell supports attaching a debugger to a Kubernetes pod forNode.js, Python, Go, Java and .NET. All you need is adebuggable container and anattach configuration of typecloudcode.kubernetes.
For information about how attaching to a Kubernetes pod differs fromdebugging a Kubernetes application, seeHow attaching a debugger to a pod differs from debugging a Kubernetes application.
To attach a debugger to your Kubernetes pod, perform the following tasks:
- To navigate to the Debug panel, clickDebugin the Activity bar.
Select and launch the configuration by pressing
F5.localhost:${debugPort}is port-forwarded todebugPortonthe container while debugging.
The debugging session is now successfully set up. You can perform the tasksyou normally do when debugging local code, like setting breakpoints andstepping through code.
To inspect variables and stack info, use theDebug Sidebar.To interact with the debugging session, use theDebug Consolein the bottom pane debugger.
To end the debugging session, click
Stopin the Debug Toolbar.
How attaching a debugger to a pod differs from debugging a Kubernetes application
| Attach to a Kubernetes pod | Debug a Kubernetes application |
|---|---|
| Debugs a single Kubernetes pod. | Debugs all the debuggable containers in the application. |
| The application must be running in the Kubernetes pod before debugging. | Runs the application on the Kubernetes cluster and attaches the debugger. |
Usesconfiguration (.vscode/launch.json) of typecloudcode.kubernetes and requestattach. | Usesconfiguration (.vscode/launch.json) of typecloudcode.kubernetes and requestlaunch.For more information, seeLaunch versus attach configurations. |
Sample Config:{ "name": "Attach to Kubernetes Pod (NodeJS)", "type": "cloudcode.kubernetes", "request": "attach", "language": "Node", "debugPort": 9229, "podSelector": { "app": "hello-world" }, "localRoot": "${workspaceFolder}", "remoteRoot": "/app"} | Sample Config:{ "name": "Run/Debug on Kubernetes", "type": "cloudcode.kubernetes", "request": "launch", "skaffoldConfig": "${workspaceFolder}/skaffold.yaml", "watch": true, "cleanUp": true, "portForward": true} |
| This configuration can't be used to run the application. | This configuration can be used to run or debug the application. |
| This configuration is language specific. | This configuration is not language specific. |
| No dedicated command. | Debug on Kubernetes command. |
What's next
- Usefile sync and hot reloading to speed up development.
- Set up acontinuous development environment in Cloud Code.
- View Kubernetes logs in Cloud Code.
Except as otherwise noted, the content of this page is licensed under theCreative Commons Attribution 4.0 License, and code samples are licensed under theApache 2.0 License. For details, see theGoogle Developers Site Policies. Java is a registered trademark of Oracle and/or its affiliates.
Last updated 2026-02-19 UTC.