

Using the Recent view
This pageapplies toApigee andApigee hybrid.
View Apigee Edge documentation.
The API Monitoring Recent view displaystreemapsof API traffic by proxy.
To access the Recent view, follow the steps inAccessing API Monitoring andselectRecent.
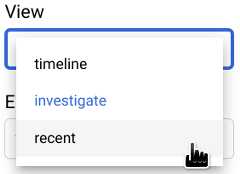
The figure below shows the UI withRecent selected.
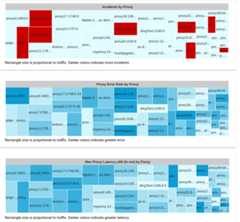
The Recent view shows three treemaps in which the API traffic for each proxy isdisplayed as a rectangle, whose size is proportional to the amount of trafficfor that proxy. The color of the rectangle indicates the relative sizeof one of the following variables (depending on which treemap you are viewing):
- Number of incidents triggered byalerts
- Error rate
- Maximum latency 50th percentile
Note that if you ignore the colors of the rectangles, all three graphsdisplay the same underlying pattern of rectangles. This is so becausethe size of each proxy'srectangle depends only on traffic, which is the same in all three graphs.
As an example, the second graph,Proxy Error Rate by Proxy,displays the relative sizes of the error rate for each proxy: the darkerthe rectangle, the greater the error rate. To see the value of the error ratefor a proxy in the Apigee UI, move the cursor over the rectangle for theproxy. An example is shown below:

The text in the rectangle displays the following data for proxy43:
- The total traffic: 760
- The error rate: 0.48
Since the error rate for proxy43 is the largest among all proxies,its rectangle has the darkest shade of blue in the graph.
By default, the Recent view displays three tables:
- Incidents by Proxy
- Proxy Error Rate by Proxy
- Max Proxy Latency p50 (in ms) by Proxy
As in theTimeline view,you can select any combinationof tables from theGraphs menu to display. All othergraph optionsare the same as in the Timeline view.
Taking a closer look at the distribution of cell data
As in the Investigate view, you can get a more granular view of the datafor an individual table cell by clickingthe cell. This displays the distributions of the cell data by severaldifferent attributes in the right-hand panel. SeeViewing the distribution of cell datafor more information.
Except as otherwise noted, the content of this page is licensed under theCreative Commons Attribution 4.0 License, and code samples are licensed under theApache 2.0 License. For details, see theGoogle Developers Site Policies. Java is a registered trademark of Oracle and/or its affiliates.
Last updated 2025-12-17 UTC.