5.3 Shiny
By adding Shiny to a dashboard, you can let viewers change underlying parameters and see the results immediately, or let dashboards update themselves incrementally as their underlying data changes (see functionsreactiveFileReader() andreactivePoll() in theshiny package). This is done by addingruntime: shiny to a standard dashboard document, and then adding one or more input controls and/or reactive expressions that dynamically drive the appearance of the components within the dashboard.
Using Shiny withflexdashboard turns a static R Markdown report into an interactive document. It is important to note that interactive documents need to be deployed to a Shiny Server to be shared broadly (whereas static R Markdown documents are standalone web pages that can be attached to emails or served from any standard web server).
Note that theshinydashboard package provides another way to create dashboards with Shiny.
5.3.1 Getting started
The steps required to add Shiny components to a dashboard are:
Add
runtime: shinyto the options declared at the top of the document (YAML metadata).Add the
{.sidebar}attribute to the first column of the dashboard to make it a host for Shiny input controls (note that this step is not strictly required, but this will generate a typical layout for Shiny-based dashboards).Add Shiny inputs and outputs as appropriate.
When including plots, be sure to wrap them in a call to
renderPlot(). This is important not only for dynamically responding to changes, but also to ensure that they are automatically re-sized when their container changes.
5.3.2 A Shiny dashboard example
Here is a simple example of a dashboard that uses Shiny (see Figure5.7 for the output):
---title: "Old Faithful Eruptions"output: flexdashboard::flex_dashboardruntime: shiny---```{r global, include=FALSE}# load data in 'global' chunk so it can be shared# by all users of the dashboardlibrary(datasets)data(faithful)```Column {.sidebar}--------------------------------------------------Waiting time between eruptions and the duration of the eruptionfor the Old Faithful geyser in Yellowstone National Park,Wyoming, USA.```{r}selectInput( "n_breaks", label = "Number of bins:", choices = c(10, 20, 35, 50), selected = 20)sliderInput( "bw_adjust", label = "Bandwidth adjustment:", min = 0.2, max = 2, value = 1, step = 0.2)```Column--------------------------------------------------### Geyser Eruption Duration```{r}renderPlot({ erpt = faithful$eruptions hist( erpt, probability = TRUE, breaks = as.integer(input$n_breaks), xlab = "Duration (minutes)", main = "Geyser Eruption Duration", col = 'gray', border = 'white' ) dens = density(erpt, adjust = input$bw_adjust) lines(dens, col = "blue", lwd = 2)})```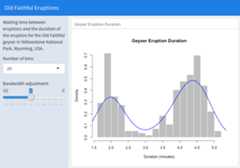
FIGURE 5.7: An interactive dashboard based on Shiny.
The first column includes the{.sidebar} attribute and two Shiny input controls; the second column includes the Shiny code required to render the chart based on the inputs.
One important thing to note about this example is the chunk labeledglobal at the top of the document. Theglobal chunk has special behavior withinflexdashboard: it is executed only once within the global environment, so that its results (e.g., data frames read from disk) can be accessed by all users of a multi-user dashboard. Loading your data within aglobal chunk will result in substantially better startup performance for your users, and hence is highly recommended.
5.3.3 Input sidebar
You add an input sidebar to a flexdashboard by adding the{.sidebar} attribute to a column, which indicates that it should be laid out flush to the left with a default width of 250 pixels and a special background color. Sidebars always appear on the left no matter where they are defined within the flow of the document.
If you are creating a dashboard with multiple pages, you may want to use a single sidebar that applies across all pages. In this case, you should define the sidebar using afirst-level Markdown header.
5.3.4 Learning more
Below are some good resources for learning more about Shiny and creating interactive documents:
The official Shiny website (http://shiny.rstudio.com) includes extensive articles, tutorials, and examples to help you learn more about Shiny.
The article “Introduction to Interactive Documents” on the Shiny website is a great guide for getting started with Shiny and R Markdown.
For deploying interactive documents, you may consider Shiny Server or RStudio Connect:https://www.rstudio.com/products/shiny/shiny-server/.