Getting Started with Blazor Smith Chart Component
24 Sep 202515 minutes to read
This section briefly explains about how to includeBlazor Smith Chart component in your Blazor WebAssembly App using Visual Studio and Visual Studio Code.
To get started quickly with Blazor Smith Chart component, check on the following video:
Prerequisites
Create a new Blazor App in Visual Studio
You can create aBlazor WebAssembly App using Visual Studio viaMicrosoft Templates or theSyncfusion® Blazor Extension.
Install Syncfusion® Blazor SmithChart NuGet in the App
To addBlazor Smith Chart component in the app, open the NuGet package manager in Visual Studio (Tools → NuGet Package Manager → Manage NuGet Packages for Solution), search and installSyncfusion.Blazor.SmithChart. Alternatively, you can utilize the following package manager command to achieve the same.
Install-PackageSyncfusion.Blazor.SmithChart-Version32.1.19NOTE
Syncfusion® Blazor components are available innuget.org. Refer toNuGet packages topic for available NuGet packages list with component details.
Prerequisites
Create a new Blazor App in Visual Studio Code
You can create aBlazor WebAssembly App using Visual Studio Code viaMicrosoft Templates or theSyncfusion® Blazor Extension.
Alternatively, you can create a WebAssembly application using the following command in the terminal(Ctrl+`).
dotnetnewblazorwasm-oBlazorAppcdBlazorAppInstall Syncfusion® Blazor SmithChart NuGet in the App
- PressCtrl+` to open the integrated terminal in Visual Studio Code.
- Ensure you’re in the project root directory where your
.csprojfile is located. - Run the following command to install aSyncfusion.Blazor.SmithChart NuGet package and ensure all dependencies are installed.
dotnetaddpackageSyncfusion.Blazor.SmithChart-v32.1.19dotnetrestoreNOTE
Syncfusion® Blazor components are available innuget.org. Refer toNuGet packages topic for available NuGet packages list with component details.
Register Syncfusion® Blazor Service
Open~/_Imports.razor file and import theSyncfusion.Blazor andSyncfusion.Blazor.Charts namespace.
@using Syncfusion.Blazor@using Syncfusion.Blazor.ChartsNow, register the Syncfusion® Blazor Service in the~/Program.cs file of your Blazor WebAssembly App.
usingMicrosoft.AspNetCore.Components.Web;usingMicrosoft.AspNetCore.Components.WebAssembly.Hosting;usingSyncfusion.Blazor;varbuilder=WebAssemblyHostBuilder.CreateDefault(args);builder.RootComponents.Add<App>("#app");builder.RootComponents.Add<HeadOutlet>("head::after");builder.Services.AddScoped(sp=>newHttpClient{BaseAddress=newUri(builder.HostEnvironment.BaseAddress)});builder.Services.AddSyncfusionBlazor();awaitbuilder.Build().RunAsync();....Add script resources
The script can be accessed from NuGet throughStatic Web Assets. Include the script reference in the<head> section of the~/index.html file.
<head> ....<scriptsrc="_content/Syncfusion.Blazor.Core/scripts/syncfusion-blazor.min.js"type="text/javascript"></script></head>NOTE
Check out theAdding Script Reference topic to learn different approaches for adding script references in your Blazor application.
Add Blazor Smith Chart component
Add the Syncfusion® Blazor Smith Chart component in the~/Pages/Index.razor file.
<SfSmithchart></SfSmithchart>Adding series to Blazor Smith Chart
Smith Chart series can be added in two ways. Use eitherPoints orDatasource in theSmithChartSeries.
If you add usingDatasource property, additionally you need to specify data source mapping fields usingReactance andResistance properties.
If you are usingPoints, you don’t need to specify mapping fields as like inDataSource. But thePoints collection should beSmithChartPoint type and defineResistance andReactance properties mandatorily.
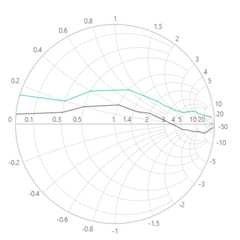
The following sample demonstrates adding two series to Smith Chart in both ways.
- First series
Transmission1showsDataSourcebound series. - Second series
Transmission2showsPointsbound series.
<SfSmithChart><SmithChartSeriesCollection><SmithChartSeriesName="Transmission1"Reactance="Reactance"Resistance="Resistance"DataSource="@FirstTransmissionSeries"></SmithChartSeries><SmithChartSeriesName="Transmission2"Points="@SecondTransmissionSeries"></SmithChartSeries></SmithChartSeriesCollection></SfSmithChart>@code { public class SmithDataSource { public double Resistance { get; set; } public double Reactance { get; set; } }; public List<SmithDataSource> FirstTransmissionSeries = new List<SmithDataSource> { new SmithDataSource { Resistance= 10, Reactance= 25 }, new SmithDataSource { Resistance= 8, Reactance= 6 }, new SmithDataSource { Resistance= 6, Reactance= 4.5 }, new SmithDataSource { Resistance= 4.5, Reactance= 2 }, new SmithDataSource { Resistance= 3.5, Reactance= 1.6 }, new SmithDataSource { Resistance= 2.5, Reactance= 1.3 }, new SmithDataSource { Resistance= 2, Reactance= 1.2 }, new SmithDataSource { Resistance= 1.5, Reactance= 1 }, new SmithDataSource { Resistance= 1, Reactance= 0.8 }, new SmithDataSource { Resistance= 0.5, Reactance= 0.4 }, new SmithDataSource { Resistance= 0.3, Reactance= 0.2 }, new SmithDataSource { Resistance= 0.001, Reactance= 0.15 } }; public List<SmithChartPoint> SecondTransmissionSeries = new List<SmithChartPoint> { new SmithChartPoint { Resistance= 20, Reactance= -50 }, new SmithChartPoint { Resistance= 10, Reactance= -10 }, new SmithChartPoint { Resistance= 9, Reactance= -4.5 }, new SmithChartPoint { Resistance= 8, Reactance= -3.5 }, new SmithChartPoint { Resistance= 7, Reactance= -2.5 }, new SmithChartPoint { Resistance= 6, Reactance= -1.5 }, new SmithChartPoint { Resistance= 5, Reactance= -1 }, new SmithChartPoint { Resistance= 4.5, Reactance= -0.5 }, new SmithChartPoint { Resistance= 2, Reactance= 0.5 }, new SmithChartPoint { Resistance= 1.5, Reactance= 0.4 }, new SmithChartPoint { Resistance= 1, Reactance= 0.4 }, new SmithChartPoint { Resistance= 0.5, Reactance= 0.2 }, new SmithChartPoint { Resistance= 0.3, Reactance= 0.1 }, new SmithChartPoint { Resistance= 0.001, Reactance= 0.05 } };}PressCtrl+F5 (Windows) or⌘+F5 (macOS) to launch the application. This will render the Syncfusion® Blazor Smith Chart component in your default web browser.
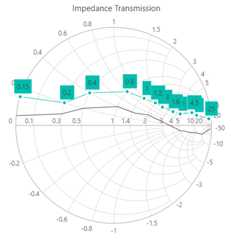
Adding Title
Title can be added to the Smith Chart to provide a quick information to the users about the context of the rendered component. Add a title by using theText property in theSmithChartTitle.
<SfSmithChart><SmithChartTitleText="Impedance Transmission"></SmithChartTitle><SmithChartSeriesCollection><SmithChartSeriesName="Transmission1"Reactance="Reactance"Resistance="Resistance"DataSource="@FirstTransmissionSeries"></SmithChartSeries><SmithChartSeriesName="Transmission2"Points="@SecondTransmissionSeries"></SmithChartSeries></SmithChartSeriesCollection></SfSmithChart>NOTE
Refer to thecode block to know about the property value of
FirstTransmissionSeriesandSecondTransmissionSeries.

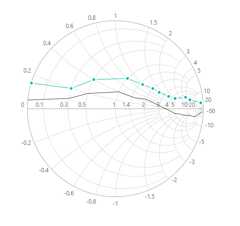
Enable Marker
To display marker for particular series, set theVisible property totrue in theSmithChartSeriesMarker.
<SfSmithChart><SmithChartTitleText="Impedance Transmission"></SmithChartTitle><SmithChartSeriesCollection><SmithChartSeriesName="Transmission1"Reactance="Reactance"Resistance="Resistance"DataSource="@FirstTransmissionSeries"><SmithChartSeriesMarkerVisible="true"></SmithChartSeriesMarker></SmithChartSeries><SmithChartSeriesName="Transmission2"Points="@SecondTransmissionSeries"></SmithChartSeries></SmithChartSeriesCollection></SfSmithChart>NOTE
Refer to thecode block to know about the property value of
FirstTransmissionSeriesandSecondTransmissionSeries.
Enable Data Label
To display data label for particular marker series, set theVisible property totrue in theSmithChartSeriesDatalabel.
<SfSmithChart><SmithChartTitleText="Impedance Transmission"></SmithChartTitle><SmithChartSeriesCollection><SmithChartSeriesName="Transmission1"Reactance="Reactance"Resistance="Resistance"DataSource="@FirstTransmissionSeries"><SmithChartSeriesMarkerVisible="true"><SmithChartSeriesDatalabelVisible="true"></SmithChartSeriesDatalabel></SmithChartSeriesMarker></SmithChartSeries><SmithChartSeriesName="Transmission2"Points="@SecondTransmissionSeries"></SmithChartSeries></SmithChartSeriesCollection></SfSmithChart>NOTE
Refer to thecode block to know the property value of
FirstTransmissionSeriesandSecondTransmissionSeries.
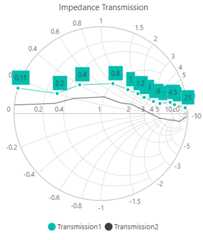
Enable Legend
Use legend for the Smith Chart by setting theVisible property totrue in theSmithChartLegendSettings. The legend name can be changed by using theName property in theSmithChartSeries.
<SfSmithChart><SmithChartLegendSettingsVisible="true"></SmithChartLegendSettings><SmithChartTitleText="Impedance Transmission"></SmithChartTitle><SmithChartSeriesCollection><SmithChartSeriesName="Transmission1"Reactance="Reactance"Resistance="Resistance"DataSource="@FirstTransmissionSeries"><SmithChartSeriesMarkerVisible="true"><SmithChartSeriesDatalabelVisible="true"></SmithChartSeriesDatalabel></SmithChartSeriesMarker></SmithChartSeries><SmithChartSeriesName="Transmission2"Points="@SecondTransmissionSeries"></SmithChartSeries></SmithChartSeriesCollection></SfSmithChart>NOTE
Refer to thecode block to know the property value of the
FirstTransmissionSeriesand theSecondTransmissionSeries.
Enable Tooltip
When space constraints prevents from displaying information using data labels, the tooltip comes in handy. The tooltip can be enabled by setting theVisible property totrue in theSmithChartSeriesTooltip.
<SfSmithChart><SmithChartLegendSettingsVisible="true"></SmithChartLegendSettings><SmithChartTitleText="Impedance Transmission"></SmithChartTitle><SmithChartSeriesCollection><SmithChartSeriesName="Transmission1"Reactance="Reactance"Resistance="Resistance"DataSource="@FirstTransmissionSeries"><SmithChartSeriesMarkerVisible="true"><SmithChartSeriesDatalabelVisible="true"></SmithChartSeriesDatalabel></SmithChartSeriesMarker><SmithChartSeriesTooltipVisible="true"></SmithChartSeriesTooltip></SmithChartSeries><SmithChartSeriesName="Transmission2"Points="@SecondTransmissionSeries"></SmithChartSeries></SmithChartSeriesCollection></SfSmithChart>NOTE
Refer to thecode block to know about the property value of the
FirstTransmissionSeriesand theSecondTransmissionSeries.

NOTE
See also
[8]ページ先頭