Getting Started with Blazor Pivot Table Component in WebAssembly App
27 Oct 202524 minutes to read
This guide explains how to add theBlazor Pivot Table component to your Blazor WebAssembly App using Visual Studio, Visual Studio Code, or .NET CLI. Follow these steps to set up and configure the component for your project.
Ready to streamline your Syncfusion® Blazor development?
Discover the full potential of Syncfusion® Blazor components with Syncfusion® AI Coding Assistants. Effortlessly integrate, configure, and enhance your projects with intelligent, context-aware code suggestions, streamlined setups, and real-time insights—all seamlessly integrated into your preferred AI-powered IDEs like VS Code, Cursor, Syncfusion® CodeStudio and more.Explore Syncfusion® AI Coding Assistants.
For a quick start with the Blazor Pivot Table component, explore thisGitHub sample.
Prerequisites
- Ensure your system meets therequirements for Blazor components.
Create a new Blazor WebAssembly App in Visual Studio
To create aBlazor WebAssembly App, use Visual Studio withMicrosoft Templates or theSyncfusion® Blazor Extension. For detailed steps, refer to theBlazor Server WASM Getting Started guide.
Install Syncfusion® Blazor Pivot Table and Themes NuGet packages
To include theBlazor Pivot Table component, open the NuGet package manager in Visual Studio (Tools → NuGet Package Manager → Manage NuGet Packages for Solution). Search for and installSyncfusion.Blazor.PivotTable andSyncfusion.Blazor.Themes. Alternatively, use the following commands in the Package Manager Console.
Install-PackageSyncfusion.Blazor.PivotTable-Version32.1.19Install-PackageSyncfusion.Blazor.Themes-Version32.1.19NOTE
Syncfusion® Blazor components are available onnuget.org. See theNuGet packages guide for a complete list of available packages and component details.
Prerequisites
- Ensure your system meets therequirements for Blazor components.
Create a new Blazor WebAssembly App in Visual Studio Code
Create aBlazor WebAssembly App using Visual Studio Code withMicrosoft Templates or theSyncfusion® Blazor Extension. For detailed instructions, refer to theBlazor WebAssembly App Getting Started guide.
Alternatively, create a WebAssembly app using the following terminal commands in Visual Studio Code (open the terminal withCtrl+`).
dotnetnewblazorwasm-oBlazorAppcdBlazorAppInstall Syncfusion® Blazor Pivot Table and Themes NuGet packages
- Open the integrated terminal in Visual Studio Code withCtrl+`.
- Navigate to the project root directory containing the
.csprojfile. - Run the following commands to install theSyncfusion.Blazor.PivotTable andSyncfusion.Blazor.Themes NuGet packages and restore dependencies.
dotnetaddpackageSyncfusion.Blazor.PivotTable-v32.1.19dotnetaddpackageSyncfusion.Blazor.Themes-v32.1.19dotnetrestoreNOTE
Syncfusion® Blazor components are available onnuget.org. See theNuGet packages guide for a complete list of available packages and component details.
Prerequisites
- Install the latest version of the.NET Core SDK. Check your installed version by running the following command in a command prompt (Windows) or terminal (macOS/Linux).
dotnet--versionCreate a Blazor WebAssembly App using .NET CLI
Run the following command in a command prompt (Windows) or terminal (macOS/Linux) to create a newBlazor WebAssembly App.
dotnetnewblazorwasm-oBlazorAppcdBlazorAppThis command creates a new Blazor WebAssembly App in a directory namedBlazorApp. For more details, see theCreate Blazor app guide and thedotnet new CLI command documentation.
Install Syncfusion® Blazor Pivot Table and Themes NuGet packages
Add theBlazor Pivot Table component by running the following commands in the command prompt (Windows) or terminal (macOS/Linux) to install theSyncfusion.Blazor.PivotTable andSyncfusion.Blazor.Themes NuGet packages.
dotnetaddpackageSyncfusion.Blazor.PivotTable-Version32.1.19dotnetaddpackageSyncfusion.Blazor.Themes-Version32.1.19dotnetrestoreNOTE
Syncfusion® Blazor components are available onnuget.org. See theNuGet packages guide for a complete list of available packages and component details.
Add import namespaces
To use the Pivot Table component, import the required namespaces. Open the~/_Imports.razor file and add theSyncfusion.Blazor andSyncfusion.Blazor.PivotView namespaces.
@using Syncfusion.Blazor@using Syncfusion.Blazor.PivotViewRegister Syncfusion® Blazor service
Next, register the Syncfusion® Blazor service in your app. Open the~/Program.cs file and add the service to enable Syncfusion components.
usingMicrosoft.AspNetCore.Components.Web;usingMicrosoft.AspNetCore.Components.WebAssembly.Hosting;usingSyncfusion.Blazor;varbuilder=WebAssemblyHostBuilder.CreateDefault(args);builder.RootComponents.Add<App>("#app");builder.RootComponents.Add<HeadOutlet>("head::after");builder.Services.AddScoped(sp=>newHttpClient{BaseAddress=newUri(builder.HostEnvironment.BaseAddress)});builder.Services.AddSyncfusionBlazor();awaitbuilder.Build().RunAsync();....Add stylesheet and script resources
Include the theme stylesheet and script for the Pivot Table component in the<head> section of the~/index.html file. These resources are accessed from NuGet throughStatic Web Assets.
<head> ....<linkhref="_content/Syncfusion.Blazor.Themes/bootstrap5.css"rel="stylesheet"/><scriptsrc="_content/Syncfusion.Blazor.Core/scripts/syncfusion-blazor.min.js"type="text/javascript"></script> //Blazor PivotTable Component script reference.<!-- <script src="_content/Syncfusion.Blazor.PivotTable/scripts/sf-pivotview.min.js" type="text/javascript"></script> --></head>NOTE
Learn more about referencing themes in theBlazor Themes guide. Explore different methods, such asStatic Web Assets,CDN, andCRG. For adding script references, refer to theAdding Script Reference guide.
Initialize the Blazor Pivot Table component
To display the Pivot Table, add the component to the~/Pages/Index.razor file. Use theSfPivotView component with the specified data type.
<SfPivotViewTValue="ProductDetails"></SfPivotView>Assigning sample data to the Blazor Pivot Table
To enable users to perform meaningful analysis and generate actionable insights, the Pivot Table component requires a well-structured data source. This data source contains the information you want to analyze and visualize.
For demonstration purposes, a collection of objects containing sales details for various products across different periods and regions has been prepared. This sample data is assigned to the Pivot Table component through theDataSource property under thePivotViewDataSourceSettings class.
<SfPivotViewTValue="ProductDetails"><PivotViewDataSourceSettingsDataSource="@dataSource"></PivotViewDataSourceSettings></SfPivotView>@code{ public List<ProductDetails> dataSource { get; set; } protected override void OnInitialized() { this.dataSource = ProductDetails.GetProductData().ToList(); } public class ProductDetails { public int Sold { get; set; } public double Amount { get; set; } public string Country { get; set; } public string Products { get; set; } public string Year { get; set; } public string Quarter { get; set; } public static List<ProductDetails> GetProductData() { List<ProductDetails> productData = new List<ProductDetails>(); productData.Add(new ProductDetails { Sold = 31, Amount = 52824, Country = "France", Products = "Mountain Bikes", Year = "FY 2022", Quarter = "Q1" }); productData.Add(new ProductDetails { Sold = 51, Amount = 86904, Country = "France", Products = "Mountain Bikes", Year = "FY 2022", Quarter = "Q2" }); productData.Add(new ProductDetails { Sold = 90, Amount = 153360, Country = "France", Products = "Mountain Bikes", Year = "FY 2022", Quarter = "Q3" }); productData.Add(new ProductDetails { Sold = 25, Amount = 42600, Country = "France", Products = "Mountain Bikes", Year = "FY 2022", Quarter = "Q4" }); productData.Add(new ProductDetails { Sold = 27, Amount = 46008, Country = "France", Products = "Mountain Bikes", Year = "FY 2023", Quarter = "Q1" }); productData.Add(new ProductDetails { Sold = 49, Amount = 83496, Country = "France", Products = "Mountain Bikes", Year = "FY 2023", Quarter = "Q2" }); productData.Add(new ProductDetails { Sold = 95, Amount = 161880, Country = "France", Products = "Mountain Bikes", Year = "FY 2023", Quarter = "Q3" }); productData.Add(new ProductDetails { Sold = 67, Amount = 114168, Country = "France", Products = "Mountain Bikes", Year = "FY 2023", Quarter = "Q4" }); productData.Add(new ProductDetails { Sold = 75, Amount = 127800, Country = "France", Products = "Mountain Bikes", Year = "FY 2024", Quarter = "Q1" }); productData.Add(new ProductDetails { Sold = 67, Amount = 114168, Country = "France", Products = "Mountain Bikes", Year = "FY 2024", Quarter = "Q2" }); productData.Add(new ProductDetails { Sold = 69, Amount = 117576, Country = "France", Products = "Mountain Bikes", Year = "FY 2024", Quarter = "Q3" }); productData.Add(new ProductDetails { Sold = 90, Amount = 153360, Country = "France", Products = "Mountain Bikes", Year = "FY 2024", Quarter = "Q4" }); productData.Add(new ProductDetails { Sold = 16, Amount = 27264, Country = "France", Products = "Mountain Bikes", Year = "FY 2025", Quarter = "Q1" }); productData.Add(new ProductDetails { Sold = 83, Amount = 124422, Country = "France", Products = "Road Bikes", Year = "FY 2022", Quarter = "Q1" }); productData.Add(new ProductDetails { Sold = 57, Amount = 85448, Country = "France", Products = "Road Bikes", Year = "FY 2022", Quarter = "Q2" }); productData.Add(new ProductDetails { Sold = 20, Amount = 29985, Country = "France", Products = "Road Bikes", Year = "FY 2022", Quarter = "Q3" }); productData.Add(new ProductDetails { Sold = 67, Amount = 70008, Country = "France", Products = "Road Bikes", Year = "FY 2023", Quarter = "Q1" }); productData.Add(new ProductDetails { Sold = 89, Amount = 60496, Country = "France", Products = "Road Bikes", Year = "FY 2023", Quarter = "Q2" }); productData.Add(new ProductDetails { Sold = 75, Amount = 801880, Country = "France", Products = "Road Bikes", Year = "FY 2023", Quarter = "Q3" }); productData.Add(new ProductDetails { Sold = 57, Amount = 204168, Country = "France", Products = "Road Bikes", Year = "FY 2023", Quarter = "Q4" }); productData.Add(new ProductDetails { Sold = 75, Amount = 737800, Country = "France", Products = "Road Bikes", Year = "FY 2024", Quarter = "Q1" }); productData.Add(new ProductDetails { Sold = 87, Amount = 884168, Country = "France", Products = "Road Bikes", Year = "FY 2024", Quarter = "Q2" }); productData.Add(new ProductDetails { Sold = 39, Amount = 729576, Country = "France", Products = "Road Bikes", Year = "FY 2024", Quarter = "Q3" }); productData.Add(new ProductDetails { Sold = 90, Amount = 38860, Country = "France", Products = "Road Bikes", Year = "FY 2024", Quarter = "Q4" }); productData.Add(new ProductDetails { Sold = 93, Amount = 139412, Country = "France", Products = "Road Bikes", Year = "FY 2022", Quarter = "Q4" }); productData.Add(new ProductDetails { Sold = 51, Amount = 92824, Country = "Germany", Products = "Mountain Bikes", Year = "FY 2022", Quarter = "Q1" }); productData.Add(new ProductDetails { Sold = 61, Amount = 76904, Country = "Germany", Products = "Mountain Bikes", Year = "FY 2022", Quarter = "Q2" }); productData.Add(new ProductDetails { Sold = 70, Amount = 43360, Country = "Germany", Products = "Mountain Bikes", Year = "FY 2022", Quarter = "Q3" }); productData.Add(new ProductDetails { Sold = 85, Amount = 62600, Country = "Germany", Products = "Mountain Bikes", Year = "FY 2022", Quarter = "Q4" }); productData.Add(new ProductDetails { Sold = 97, Amount = 86008, Country = "Germany", Products = "Mountain Bikes", Year = "FY 2023", Quarter = "Q1" }); productData.Add(new ProductDetails { Sold = 69, Amount = 93496, Country = "Germany", Products = "Mountain Bikes", Year = "FY 2023", Quarter = "Q2" }); productData.Add(new ProductDetails { Sold = 45, Amount = 301880, Country = "Germany", Products = "Mountain Bikes", Year = "FY 2023", Quarter = "Q3" }); productData.Add(new ProductDetails { Sold = 77, Amount = 404168, Country = "Germany", Products = "Mountain Bikes", Year = "FY 2023", Quarter = "Q4" }); productData.Add(new ProductDetails { Sold = 15, Amount = 137800, Country = "Germany", Products = "Mountain Bikes", Year = "FY 2024", Quarter = "Q1" }); productData.Add(new ProductDetails { Sold = 37, Amount = 184168, Country = "Germany", Products = "Mountain Bikes", Year = "FY 2024", Quarter = "Q2" }); productData.Add(new ProductDetails { Sold = 49, Amount = 89576, Country = "Germany", Products = "Mountain Bikes", Year = "FY 2024", Quarter = "Q3" }); productData.Add(new ProductDetails { Sold = 40, Amount = 33360, Country = "Germany", Products = "Mountain Bikes", Year = "FY 2024", Quarter = "Q4" }); productData.Add(new ProductDetails { Sold = 96, Amount = 77264, Country = "Germany", Products = "Mountain Bikes", Year = "FY 2025", Quarter = "Q1" }); productData.Add(new ProductDetails { Sold = 23, Amount = 24422, Country = "Germany", Products = "Road Bikes", Year = "FY 2022", Quarter = "Q1" }); productData.Add(new ProductDetails { Sold = 67, Amount = 75448, Country = "Germany", Products = "Road Bikes", Year = "FY 2022", Quarter = "Q2" }); productData.Add(new ProductDetails { Sold = 70, Amount = 52345, Country = "Germany", Products = "Road Bikes", Year = "FY 2022", Quarter = "Q3" }); productData.Add(new ProductDetails { Sold = 13, Amount = 135612, Country = "Germany", Products = "Road Bikes", Year = "FY 2022", Quarter = "Q4" }); productData.Add(new ProductDetails { Sold = 57, Amount = 90008, Country = "Germany", Products = "Road Bikes", Year = "FY 2023", Quarter = "Q1" }); productData.Add(new ProductDetails { Sold = 29, Amount = 90496, Country = "Germany", Products = "Road Bikes", Year = "FY 2023", Quarter = "Q2" }); productData.Add(new ProductDetails { Sold = 45, Amount = 301880, Country = "Germany", Products = "Road Bikes", Year = "FY 2023", Quarter = "Q3" }); productData.Add(new ProductDetails { Sold = 77, Amount = 404168, Country = "Germany", Products = "Road Bikes", Year = "FY 2023", Quarter = "Q4" }); productData.Add(new ProductDetails { Sold = 15, Amount = 137800, Country = "Germany", Products = "Road Bikes", Year = "FY 2024", Quarter = "Q1" }); productData.Add(new ProductDetails { Sold = 37, Amount = 184168, Country = "Germany", Products = "Road Bikes", Year = "FY 2024", Quarter = "Q2" }); productData.Add(new ProductDetails { Sold = 99, Amount = 829576, Country = "Germany", Products = "Road Bikes", Year = "FY 2024", Quarter = "Q3" }); productData.Add(new ProductDetails { Sold = 80, Amount = 38360, Country = "Germany", Products = "Road Bikes", Year = "FY 2024", Quarter = "Q4" }); productData.Add(new ProductDetails { Sold = 91, Amount = 67824, Country = "United States", Products = "Mountain Bikes", Year = "FY 2022", Quarter = "Q1" }); productData.Add(new ProductDetails { Sold = 81, Amount = 99904, Country = "United States", Products = "Mountain Bikes", Year = "FY 2022", Quarter = "Q2" }); productData.Add(new ProductDetails { Sold = 70, Amount = 49360, Country = "United States", Products = "Mountain Bikes", Year = "FY 2022", Quarter = "Q3" }); productData.Add(new ProductDetails { Sold = 65, Amount = 69600, Country = "United States", Products = "Mountain Bikes", Year = "FY 2022", Quarter = "Q4" }); productData.Add(new ProductDetails { Sold = 57, Amount = 90008, Country = "United States", Products = "Mountain Bikes", Year = "FY 2023", Quarter = "Q1" }); productData.Add(new ProductDetails { Sold = 29, Amount = 90496, Country = "United States", Products = "Mountain Bikes", Year = "FY 2023", Quarter = "Q2" }); productData.Add(new ProductDetails { Sold = 85, Amount = 391880, Country = "United States", Products = "Mountain Bikes", Year = "FY 2023", Quarter = "Q3" }); productData.Add(new ProductDetails { Sold = 97, Amount = 904168, Country = "United States", Products = "Mountain Bikes", Year = "FY 2023", Quarter = "Q4" }); productData.Add(new ProductDetails { Sold = 85, Amount = 237800, Country = "United States", Products = "Mountain Bikes", Year = "FY 2024", Quarter = "Q1" }); productData.Add(new ProductDetails { Sold = 77, Amount = 384168, Country = "United States", Products = "Mountain Bikes", Year = "FY 2024", Quarter = "Q2" }); productData.Add(new ProductDetails { Sold = 99, Amount = 829576, Country = "United States", Products = "Mountain Bikes", Year = "FY 2024", Quarter = "Q3" }); productData.Add(new ProductDetails { Sold = 80, Amount = 38360, Country = "United States", Products = "Mountain Bikes", Year = "FY 2024", Quarter = "Q4" }); productData.Add(new ProductDetails { Sold = 76, Amount = 97264, Country = "United States", Products = "Mountain Bikes", Year = "FY 2025", Quarter = "Q1" }); productData.Add(new ProductDetails { Sold = 53, Amount = 94422, Country = "United States", Products = "Road Bikes", Year = "FY 2022", Quarter = "Q1" }); productData.Add(new ProductDetails { Sold = 90, Amount = 45448, Country = "United States", Products = "Road Bikes", Year = "FY 2022", Quarter = "Q2" }); productData.Add(new ProductDetails { Sold = 29, Amount = 92345, Country = "United States", Products = "Road Bikes", Year = "FY 2022", Quarter = "Q3" }); productData.Add(new ProductDetails { Sold = 67, Amount = 235612, Country = "United States", Products = "Road Bikes", Year = "FY 2022", Quarter = "Q4" }); productData.Add(new ProductDetails { Sold = 97, Amount = 90008, Country = "United States", Products = "Road Bikes", Year = "FY 2023", Quarter = "Q1" }); productData.Add(new ProductDetails { Sold = 79, Amount = 90496, Country = "United States", Products = "Road Bikes", Year = "FY 2023", Quarter = "Q2" }); productData.Add(new ProductDetails { Sold = 95, Amount = 501880, Country = "United States", Products = "Road Bikes", Year = "FY 2023", Quarter = "Q3" }); productData.Add(new ProductDetails { Sold = 97, Amount = 104168, Country = "United States", Products = "Road Bikes", Year = "FY 2023", Quarter = "Q4" }); productData.Add(new ProductDetails { Sold = 95, Amount = 837800, Country = "United States", Products = "Road Bikes", Year = "FY 2024", Quarter = "Q1" }); productData.Add(new ProductDetails { Sold = 87, Amount = 684168, Country = "United States", Products = "Road Bikes", Year = "FY 2024", Quarter = "Q2" }); productData.Add(new ProductDetails { Sold = 109, Amount = 29576, Country = "United States", Products = "Road Bikes", Year = "FY 2024", Quarter = "Q3" }); productData.Add(new ProductDetails { Sold = 99, Amount = 345860, Country = "United States", Products = "Road Bikes", Year = "FY 2024", Quarter = "Q4" }); return productData; } }}Adding fields to row, column, value, and filter axes
Organizing fields into appropriate axes transforms raw data into a structured, meaningful Pivot Table that enables users to analyze patterns and trends effectively. With the Pivot Table now initialized and populated with sample data, the next logical step involves organizing the appropriate fields into row, column, value, and filter axes to create a functional data analysis tool.
In thePivotViewDataSourceSettings class, four primary axes play a crucial role in defining and organizing fields from the bound data source to render the Pivot Table component in the desired format.
Understanding the four axes:
- PivotViewRows – Collection of fields that will be displayed along the row axis of the Pivot Table.
- PivotViewColumns – Collection of fields that will be displayed along the column axis of the Pivot Table.
- PivotViewValues – Collection of fields that will be displayed as aggregated numeric values within the Pivot Table.
- PivotViewFilters – Collection of fields that act as master filters over the data bound to the row, column, and value axes of the Pivot Table.
Essential field properties:
To define each field in its respective axis, configure the following basic properties:
- Name: Sets the field name from the bound data source. The casing must match exactly as it appears in the data source, otherwise the Pivot Table will not render correctly.
- Caption: Sets the field caption, which serves as the display name for the field in the Pivot Table.
- Type: Sets the summary type for the field. By default, theSummaryTypes.Sum aggregation is applied.
<SfPivotViewTValue="ProductDetails"Height="300"><PivotViewDataSourceSettingsDataSource="@dataSource"><PivotViewColumns><PivotViewColumnName="Year"></PivotViewColumn><PivotViewColumnName="Quarter"></PivotViewColumn></PivotViewColumns><PivotViewRows><PivotViewRowName="Country"></PivotViewRow><PivotViewRowName="Products"></PivotViewRow></PivotViewRows><PivotViewValues><PivotViewValueName="Sold"Caption="Units Sold"></PivotViewValue><PivotViewValueName="Amount"Caption="Sold Amount"></PivotViewValue></PivotViewValues></PivotViewDataSourceSettings></SfPivotView>@code{ public List<ProductDetails> dataSource { get; set; } protected override void OnInitialized() { this.dataSource = ProductDetails.GetProductData().ToList(); //Bind the data source collection here. Refer "Assigning sample data to the pivot table" (https://blazor.syncfusion.com/documentation/pivot-table/getting-started#assigning-sample-data-to-the-blazor-pivot-table) section for more details. }}Applying formatting to a value field
Formatting enhances the readability and presentation of numerical data in a Pivot Table, making it more user-friendly and professional. For example, you can display values with currency symbols or adjust the number of decimal places for greater clarity.
To apply formatting to value fields in a Pivot Table, use thePivotViewFormatSettings class. This class accepts a list ofPivotViewFormatSetting objects, each defining formatting rules for a specific field in your data.
Within eachPivotViewFormatSetting object, set theName property to match the exact field name from your value section. Then, specify the desired display format using theFormat property. In the example below, theAmount field is configured to display values in currency format using the “C” pattern, which includes currency symbols.
NOTE
Formatting can only be applied to numeric fields in the value section of the Pivot Table.
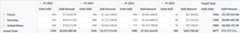
<SfPivotViewTValue="ProductDetails"Height="300"><PivotViewDataSourceSettingsDataSource="@dataSource"><PivotViewColumns><PivotViewColumnName="Year"></PivotViewColumn><PivotViewColumnName="Quarter"></PivotViewColumn></PivotViewColumns><PivotViewRows><PivotViewRowName="Country"></PivotViewRow><PivotViewRowName="Products"></PivotViewRow></PivotViewRows><PivotViewValues><PivotViewValueName="Sold"Caption="Units Sold"></PivotViewValue><PivotViewValueName="Amount"Caption="Sold Amount"></PivotViewValue></PivotViewValues><PivotViewFormatSettings><PivotViewFormatSettingName="Amount"Format="C"></PivotViewFormatSetting></PivotViewFormatSettings></PivotViewDataSourceSettings></SfPivotView>@code{ public List<ProductDetails> dataSource { get; set; } protected override void OnInitialized() { this.dataSource = ProductDetails.GetProductData().ToList(); //Bind the data source collection here. Refer "Assigning sample data to the pivot table" (https://blazor.syncfusion.com/documentation/pivot-table/getting-started#assigning-sample-data-to-the-blazor-pivot-table) section for more details. }}- PressCtrl+F5 (Windows) or⌘+F5 (macOS) to launch the application. This will render the Syncfusion® Blazor Pivot Table component in your default web browser like below.
Enable Field List
The field list enhances user interaction by allowing you to dynamically add, remove, and rearrange fields across different axes, including column, row, value, and filter axes. This user-friendly interface also provides sorting and filtering options that can be applied at runtime without requiring code changes.
To enable the field list, set theShowFieldList property in theSfPivotView class totrue. This activates the field list interface, making it accessible to users to modify Pivot Table report settings. For comprehensive details about field list functionality,refer to the dedicated field list documentation.
<SfPivotViewTValue="ProductDetails"ShowFieldList="true"Height="300"><PivotViewDataSourceSettingsDataSource="@dataSource"><PivotViewColumns><PivotViewColumnName="Year"></PivotViewColumn><PivotViewColumnName="Quarter"></PivotViewColumn></PivotViewColumns><PivotViewRows><PivotViewRowName="Country"></PivotViewRow><PivotViewRowName="Products"></PivotViewRow></PivotViewRows><PivotViewValues><PivotViewValueName="Sold"Caption="Units Sold"></PivotViewValue><PivotViewValueName="Amount"Caption="Sold Amount"></PivotViewValue></PivotViewValues><PivotViewFormatSettings><PivotViewFormatSettingName="Amount"Format="C"></PivotViewFormatSetting></PivotViewFormatSettings></PivotViewDataSourceSettings></SfPivotView>@code{ public List<ProductDetails> dataSource { get; set; } protected override void OnInitialized() { this.dataSource = ProductDetails.GetProductData().ToList(); //Bind the data source collection here. Refer "Assigning sample data to the pivot table" (https://blazor.syncfusion.com/documentation/pivot-table/getting-started#assigning-sample-data-to-the-blazor-pivot-table) section for more details. }}Enable Grouping Bar
The grouping bar allows users to easily manage and modify the report settings of the Pivot Table directly through the user interface. With the grouping bar, users can instantly move fields between columns, rows, values, and filters by dragging them, allowing for quick arrangement and analysis of the data.
Users can also use the grouping bar to sort, filter, or remove fields quickly without needing to write any code. To enable the grouping bar, set theShowGroupingBar property in theSfPivotView class totrue. For more details about using the grouping bar, see theGrouping Bar documentation.
<SfPivotViewTValue="ProductDetails"ShowGroupingBar="true"Height="300"><PivotViewDataSourceSettingsDataSource="@dataSource"><PivotViewColumns><PivotViewColumnName="Year"></PivotViewColumn><PivotViewColumnName="Quarter"></PivotViewColumn></PivotViewColumns><PivotViewRows><PivotViewRowName="Country"></PivotViewRow><PivotViewRowName="Products"></PivotViewRow></PivotViewRows><PivotViewValues><PivotViewValueName="Sold"Caption="Units Sold"></PivotViewValue><PivotViewValueName="Amount"Caption="Sold Amount"></PivotViewValue></PivotViewValues><PivotViewFormatSettings><PivotViewFormatSettingName="Amount"Format="C"></PivotViewFormatSetting></PivotViewFormatSettings></PivotViewDataSourceSettings></SfPivotView>@code{ public List<ProductDetails> dataSource { get; set; } protected override void OnInitialized() { this.dataSource = ProductDetails.GetProductData().ToList(); //Bind the data source collection here. Refer "Assigning sample data to the pivot table" (https://blazor.syncfusion.com/documentation/pivot-table/getting-started#assigning-sample-data-to-the-blazor-pivot-table) section for more details. }}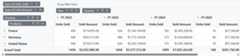
Exploring Filter Axis
The filter axis lets you show only the data you need in the Blazor Pivot Table, making analysis simpler. You can add fields to the filter axis to control what data appears in thePivotViewRows,PivotViewColumns, andPivotViewValues axes. You can set up these fields in two ways: by adding them to thePivotViewFilters collection in your code, or by dragging and dropping fields from other axes to the filter axis using the grouping bar or field list during runtime. This helps you focus on specific data without changing the Pivot Table’s structure.
The following example shows how to add a field to the filter axis in a Blazor Pivot Table:
<SfPivotViewTValue="ProductDetails"ShowGroupingBar="true"ShowFieldList="true"Height="300"><PivotViewDataSourceSettingsDataSource="@dataSource"><PivotViewColumns><PivotViewColumnName="Year"></PivotViewColumn><PivotViewColumnName="Quarter"></PivotViewColumn></PivotViewColumns><PivotViewRows><PivotViewRowName="Products"></PivotViewRow></PivotViewRows><PivotViewFilters><PivotViewFilterName="Country"></PivotViewFilter></PivotViewFilters><PivotViewValues><PivotViewValueName="Sold"Caption="Units Sold"></PivotViewValue><PivotViewValueName="Amount"Caption="Sold Amount"></PivotViewValue></PivotViewValues><PivotViewFormatSettings><PivotViewFormatSettingName="Amount"Format="C"></PivotViewFormatSetting></PivotViewFormatSettings></PivotViewDataSourceSettings></SfPivotView>@code{ public List<ProductDetails> dataSource { get; set; } protected override void OnInitialized() { this.dataSource = ProductDetails.GetProductData().ToList(); //Bind the data source collection here. Refer "Assigning sample data to the pivot table" (https://blazor.syncfusion.com/documentation/pivot-table/getting-started#assigning-sample-data-to-the-blazor-pivot-table) section for more details. }}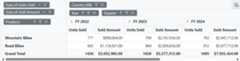
Calculated Field
The calculated field feature enables users to create custom value fields using mathematical formulas and existing fields from their data source. Users can perform complex calculations with basic arithmetic operators and seamlessly integrate these custom fields into their Pivot Table for enhanced data visualization and reporting.
Users can add calculated fields in two ways:
- Using code: Set up calculated fields through thePivotViewCalculatedFieldSettings class when configuring the Pivot Table.
- Using the user interface: Alternatively, calculated fields can be added at runtime through a built-in dialog by setting theAllowCalculatedField property in the SfPivotView class totrue. When enabled, a button appears in the Field List UI. Clicking this button opens a dialog that allows users to create, edit, or remove calculated fields at runtime. To learn more about calculated fields,refer here.
NOTE
By default, the calculated fields created through code-behind are only added to the field list and calculated field dialog UI. To display the calculated field in the Pivot Table UI, it must be added to thePivotViewValues class, as shown in the code below. Additionally, calculated fields can only be added to the value axis.
Below is a sample code that shows how to set up calculated fields both through code-behind and using the popup dialog:
<SfPivotViewTValue="ProductDetails"ShowFieldList="true"AllowCalculatedField="true"Height="300"><PivotViewDataSourceSettingsDataSource="@dataSource"><PivotViewColumns><PivotViewColumnName="Year"></PivotViewColumn><PivotViewColumnName="Quarter"></PivotViewColumn></PivotViewColumns><PivotViewRows><PivotViewRowName="Country"></PivotViewRow><PivotViewRowName="Products"></PivotViewRow></PivotViewRows><PivotViewValues><PivotViewValueName="Sold"Caption="Unit Sold"></PivotViewValue><PivotViewValueName="Amount"Caption="Sold Amount"></PivotViewValue><PivotViewValueName="Total"Caption="Total Amount"></PivotViewValue></PivotViewValues><PivotViewFormatSettings><PivotViewFormatSettingName="Amount"Format="C"></PivotViewFormatSetting><PivotViewFormatSettingName="Total"Format="C"></PivotViewFormatSetting></PivotViewFormatSettings><PivotViewCalculatedFieldSettings><PivotViewCalculatedFieldSettingName="Total"Formula="@totalPrice"></PivotViewCalculatedFieldSetting></PivotViewCalculatedFieldSettings></PivotViewDataSourceSettings></SfPivotView>@code{ public string totalPrice = "\"" + "Sum(Amount)" + "\"" + "+" + "\"" + "Sum(Sold)" + "\""; public List<ProductDetails> dataSource { get; set; } protected override void OnInitialized() { this.dataSource = ProductDetails.GetProductData().ToList(); //Bind the data source collection here. Refer "Assigning sample data to the pivot table" (https://blazor.syncfusion.com/documentation/pivot-table/getting-started#assigning-sample-data-to-the-blazor-pivot-table) section for more details. }}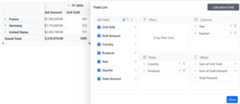
Handling exceptions
You can handle errors that occur during Pivot Table actions without stopping your application. Use theOnActionFailure event to capture error messages or details from the server. We recommend binding this event while building your app, as it helps you identify issues early. You can share these error details with our support team to get help quickly.
The following code example shows how to display a server-side error message to the user when a data operation fails:
<spanclass="error">@ErrorDetails</span><SfPivotViewTValue="PivotViewData"Width="100%"Height="450"AllowDataCompression="true"EnableVirtualization="true"ShowFieldList="true"ShowGroupingBar="true"MaxNodeLimitInMemberEditor="50"><PivotViewDataSourceSettingsTValue="PivotViewData"Url="https://some.com/invalidUrl"ExpandAll="false"EnableSorting="true"EnableServerSideAggregation="true"AlwaysShowValueHeader="true"><PivotViewColumns><PivotViewColumnName="Year"Caption="Production Year"></PivotViewColumn></PivotViewColumns><PivotViewRows><PivotViewRowName="ProductID"Caption="Product ID"></PivotViewRow></PivotViewRows><PivotViewValues><PivotViewValueName="Sold"Caption="Unit Sold"></PivotViewValue><PivotViewValueName="Price"Caption="Unit Amount"></PivotViewValue></PivotViewValues><PivotViewFormatSettings><PivotViewFormatSettingName="Price"Format="C0"></PivotViewFormatSetting><PivotViewFormatSettingName="Sold"Format="N0"></PivotViewFormatSetting></PivotViewFormatSettings></PivotViewDataSourceSettings><PivotViewGridSettingsColumnWidth="120"></PivotViewGridSettings><PivotViewEventsTValue="PivotViewData"OnActionFailure="ActionFailure"></PivotViewEvents></SfPivotView><style> .error { color: red; }</style>@code{ public string ErrorDetails = ""; public class PivotViewData { public string ProductID { get; set; } public string Country { get; set; } public string Product { get; set; } public double Sold { get; set; } public double Price { get; set; } public string Year { get; set; } } public void ActionFailure(PivotActionFailureEventArgs args) { this.ErrorDetails = args.ErrorInfo.Message; StateHasChanged(); }}NOTE
See also
[8]ページ先頭