Computing Frequency Analyses with fasstr
Source:vignettes/fasstr_frequency_analysis.Rmdfasstr_frequency_analysis.Rmdfasstr, the Flow Analysis Summary Statistics Tool for R,is a set ofR functions totidy, summarize, analyze, trend, and visualize streamflow data. Thispackage summarizes continuous daily mean streamflow data into variousdaily, monthly, annual, and long-term statistics, completes trending andfrequency analyses, with outputs in both table and plot formats.
This vignette is a guide on the various volume frequency analysisfunctions found infasstr to plot frequency data anddetermine frequency quantile statistics using the Log-Pearson Type IIIor Weibull distributions. In this vignette you’ll learn what functionsto use for specific analyses, arguments to customize analyses, and whatresults and outputs are produced.
Overview
Computing a frequency analysis withfasstr allows foroptions and customization of both the inputs and outputs. Thesefunctions plot probabilities of flow data using chosen plotting optionsand calculates frequency quantiles (ex. 7Q10) based on fitting data toeither Log-Pearson Type III or Weibull distributions. There are fourfunctions withinfasstr that conduct frequencyanalyses:
compute_annual_frequencies()- conductan annual frequency analysis from daily streamflow data (analysiscalculates minimums/maximums and subsequently ranks that data).compute_frequency_quantile()- conductan annual frequency analysis from daily streamflow data and return aspecific quantile based on a duration (rolling mean days) and returnperiod (analysis calculates minimums/maximums and subsequently ranksthat data).compute_HYDAT_peak_frequencies()-conduct an annual frequency analysis from instantaneous peak data(minimum or maximum) for stations from a HYDAT database.compute_frequency_analysis()- conducta frequency analysis with custom data (analysis ranks data provided; isthe main frequency analysis function used within each of the frequencyanalysis functions).
With the exception of thecompute_frequency_quantile()function which only produces a quantile value, the frequency functionsproduce five outputs contained within a list. See the sections below formore information on each output and options. The five outputs includethe following:
- Freq_Analysis_Data - data used for analysis (eitherdata provided in
compute_frequency_analysis(), computedextremes incompute_annual_frequencies(), or HYDATextracted extremes incompute_HYDAT_peak_frequencies()). - Freq_Plot_Data - data used to plot probabilitiesbased on the selected plotting positions (weibull, hazen, or median),includes the event values, probability and return periods. Option toinclude/exclude the compute curve.
- Freq_Plot - plot of event probabilities based onthe selected plotting positions (weibull, hazen, or median).
- Freq_Fitting - a
fitdistplus::fitdistobject that contains information on the computed curve based on theselected distribution (Pearson Type III (or log of) or weibull) andfitting methods (methods of moments or maximum likelihoodestimation). - Freq_Fitted_Quantiles - the computed fittedquantiles based on the selected fitting options and selected quantileprobabilities.
Functions and Data Inputs
Annual Daily Minimums/Maximums
To determine frequencies of annual daily minimum or daily maximumflows, or of any duration days, from a daily streamflow data set, thecompute_annual_frequencies() andcompute_frequency_quantile() functions will take dailydata, either from HYDAT using thestation_number argumentor your own data frame of data using thedata argument tocomplete an analysis. As with mostfasstr functions,options for rolling days, missing values, and date filtering can becompleted using the function arguments (roll_days, water_year_start,etc).
Thecompute_annual_frequencies() function will produceall five outputs from the analysis, as listed above, including theplotting data, plot, and computed quantiles. If just the quantile isdesired, and assuming your data fits the selected distributions, thecompute_frequency_quantile() function can be used. Bysupplying the desired duration (roll_days argument) and thedesired return period (return_period argument) a singlenumeric quantile value will be returned from the data.
Annual Peak Minimums/Maximums from HYDAT
compute_HYDAT_peak_frequencies()
To determine frequencies of annual instantaneous minimum or maximumflows from stations from HYDAT, thecompute_HYDAT_peak_frequencies() function will extract thedata, if available, and complete the analysis. As this data is extractedfrom HYDAT by listing the station using thestation_numberargument and no pre-filtering is completed on the data, thedata argument and many of the filtering arguments are notavailable for this function. If you have a data frame of your owninstantaneous maximums or minimums, a custom analysis can be completedusing thecompute_frequency_analysis() function asdescribed below.
Custom Data
To complete a frequency analysis using custom data, likepeaks-over-threshold analyses, thecompute_frequency_analysis() function will take theprovided data and complete the analysis. The data provided must containthree columns:
- events - the year or other label to identify thespecific flow event (could have 1999a and 1999b if doing apeaks-over-threshold).
- values - the flow value in cubic metres persecond.
- measures - the type of flow value/event(i.e. “Inst. Peak” or “7-Day Low”); can have multiple measures (ex.3-day and 7-day) that will be plotted and computed.
Here is an example of data the can be provided, wrangled from theannual lowflows function:
low_flows<-calc_annual_lowflows(station_number="08NM116", start_year=1980, end_year=2000, roll_days=7)low_flows<-dplyr::select(low_flows,Year, Value=Min_7_Day)low_flows<-dplyr::mutate(low_flows, Measure="7-Day")low_flows Year Value Measure1 1980 0.6554286 7-Day2 1981 0.8852857 7-Day3 1982 1.0484286 7-Day4 1983 0.6335714 7-Day5 1984 0.7842857 7-Day6 1985 0.5892857 7-Day7 1986 0.7185714 7-Day8 1987 0.3554286 7-Day9 1988 0.1864286 7-Day10 1989 0.5771429 7-Day11 1990 0.9578571 7-Day12 1991 0.5078571 7-Day13 1992 0.5178571 7-Day14 1993 0.2981429 7-Day15 1994 0.4650000 7-Day16 1995 0.6657143 7-Day17 1996 0.9964286 7-Day18 1997 1.2628571 7-Day19 1998 0.5864286 7-Day20 1999 0.7337143 7-Day21 2000 0.5028571 7-DayThis data can then be applied to thecompute_frequency_analysis() function. This example has thedefault column names in the data and this do not need to be listed, butare shown for demonstration.
compute_frequency_analysis(data=low_flows, events=Year, values=Value, measures=Measure)Usage, Options, and Outputs
Analysis Data
The returnedFreq_Analysis_Data object provides theraw data used in the frequency analyses. Based on the selected frequencyfunction used, this tibble will contain the respective data; theprovided values with the custom analysis, the computed extremes with theannual analysis, and the HYDAT extreme peaks from HYDAT in the peakanalysis. See each functions’ documentation for more information. Thistibble object provides the analysis data as the annual and HYDAT peakdata are calculated or extracted from HYDAT.
To provide examples of the outputs, an annual analysis will becompleted on a Mission Creek HYDAT station (theplot_curveargument is set toFALSE for the start of thisexample):
freq_analysis<-compute_annual_frequencies(station_number="08NM116", start_year=1981, end_year=2010, roll_days=7, plot_curve=FALSE)The following is an example of the returnedFreq_Analysis_Data tibble:
freq_analysis$Freq_Analysis_Data Year Measure Value1 1981 7-Day 0.88528572 1982 7-Day 1.04842863 1983 7-Day 0.63357144 1984 7-Day 0.78428575 1985 7-Day 0.58928576 1986 7-Day 0.71857147 1987 7-Day 0.35542868 1988 7-Day 0.18642869 1989 7-Day 0.577142910 1990 7-Day 0.957857111 1991 7-Day 0.507857112 1992 7-Day 0.517857113 1993 7-Day 0.298142914 1994 7-Day 0.465000015 1995 7-Day 0.665714316 1996 7-Day 0.996428617 1997 7-Day 1.262857118 1998 7-Day 0.586428619 1999 7-Day 0.733714320 2000 7-Day 0.502857121 2001 7-Day 0.570571422 2002 7-Day 0.331428623 2003 7-Day 0.362857124 2004 7-Day 0.522857125 2005 7-Day 0.889000026 2006 7-Day 0.696714327 2007 7-Day 0.453857128 2008 7-Day 0.462857129 2009 7-Day 0.502142930 2010 7-Day 0.4535714Frequency Plotting
Based on the analysis data in theFreq_Analysis_Dataobject, the data is ranked, by default for low-flow frequencies, fromlow to high with the lowest flow value ranked at 1. To completehigh-flow analyses and rank the data from high to low, set theuse_max argument toTRUE. The probabilities ofeach event are then determined using the following generalize plottingequation:
- P = (m - A) / (n + 1 - A - B)
where:
- m is the rank of the value
- n the total number of events in the data
- A & B are the constants depending on which plotting position isused (weibull, median, or hazen)
The probability plotting positions (A and B constants) are selectedusing theprob_plot_position argument, listing'weibull' where A and B are 0,'median' whereA and B are 0.3, or'hazen' where A and B are 0.5. Theselected plotting position does not have an effect on the final computedcurve. To plot the data on a logarithmic scale, set theuse_log argument toTRUE.
With these options set, the data used for plotting is returned in theFreq_Plot_Data tibble object. The events are sorted bymeasure, and ranked by the event value, and provides the probability andthe return period for each event, used for plotting. See the followingfor an example of this output:
freq_analysis$Freq_Plot_Data Year Measure Value Probability Return.Period1 1988 7-Day 0.1864286 0.03225806 31.0000002 1993 7-Day 0.2981429 0.06451613 15.5000003 2002 7-Day 0.3314286 0.09677419 10.3333334 1987 7-Day 0.3554286 0.12903226 7.7500005 2003 7-Day 0.3628571 0.16129032 6.2000006 2010 7-Day 0.4535714 0.19354839 5.1666677 2007 7-Day 0.4538571 0.22580645 4.4285718 2008 7-Day 0.4628571 0.25806452 3.8750009 1994 7-Day 0.4650000 0.29032258 3.44444410 2009 7-Day 0.5021429 0.32258065 3.10000011 2000 7-Day 0.5028571 0.35483871 2.81818212 1991 7-Day 0.5078571 0.38709677 2.58333313 1992 7-Day 0.5178571 0.41935484 2.38461514 2004 7-Day 0.5228571 0.45161290 2.21428615 2001 7-Day 0.5705714 0.48387097 2.06666716 1989 7-Day 0.5771429 0.51612903 1.93750017 1998 7-Day 0.5864286 0.54838710 1.82352918 1985 7-Day 0.5892857 0.58064516 1.72222219 1983 7-Day 0.6335714 0.61290323 1.63157920 1995 7-Day 0.6657143 0.64516129 1.55000021 2006 7-Day 0.6967143 0.67741935 1.47619022 1986 7-Day 0.7185714 0.70967742 1.40909123 1999 7-Day 0.7337143 0.74193548 1.34782624 1984 7-Day 0.7842857 0.77419355 1.29166725 1981 7-Day 0.8852857 0.80645161 1.24000026 2005 7-Day 0.8890000 0.83870968 1.19230827 1990 7-Day 0.9578571 0.87096774 1.14814828 1996 7-Day 0.9964286 0.90322581 1.10714329 1982 7-Day 1.0484286 0.93548387 1.06896630 1997 7-Day 1.2628571 0.96774194 1.033333This data is then used for plotting and returned in theFreq_Plotggplot2 object. See the examplebelow. To change the probabilities/vertical lines shown on the x-axis,change the values using theprob_scale_points argument tolist the breaks.
freq_analysis$Freq_Plot
Distribution Fitting and Computing Frequency Quantiles
Thefasstr functions also compute frequency quantiles,like commonly used 7Q5, 7Q10, 5Q30, etc. Calculating frequency quantilesrequires fitting historical event data (annual minimums, maximums orothers) to a probability distribution (i.e. Log-Pearson Type III orWeibull infasstr). The flow quantiles are then extractedfrom the distribution for given probabilities (and equivalent returnperiods). In thefasstr frequency analysis functions, thisis done so by choosing a probability distribution and method of fittingto fit the data (may require data exploration for determining mostappropriate distribution). Results from this fitting are found in 3objects:
- Freq_Plot - the computed frequency curves areplotted against the plotted events data when the
plot_curveargument toTRUE(default). - Freq_Fitting - a
fitdistplus::fitdistobject that contains information about the fitting, including variousparameter estimates, fitting statistics, and various plots. - Freq_Fitted_Quantiles - the computed fittedquantiles based on the selected fitting options and selected quantileprobabilities.
Fitting Data to Probability Distributions
Computing frequency quantiles infasstr requireschoosing a probability distribution to fit the data, either Log-PearsonType III,"PIII" (default), or Weibull,"weibull", distributions with thefit_distargument. When using the"PIII" distribution, data providedis log-transformed (base 10) before being fit to a Pearson Type IIIdistribution. The method of fitting data to distributions is selectedusing thefit_distr_method argument with either"MLE" for ‘maximum likelihood estimation’ or"MOM" (default) for ‘method of moments’. For the"PIII" distribution, the data will be fit using"MOM" or"MLE", while"weibull"can only use"MOM". Internally, these arguments are passedon to thefitdistrplus::fitdist function from the‘fitdistrplus’package (see for more information). Fitting results from thefitdistrplus::fitdist function are returned in theFreq_Fitting object in the list and contain informationregarding the fitting process, including the parameter estimates(e.g. shape, location, and scale), AIC statistics, Q-Q and densityplots, amongst other statistics. As per thefitdistrplus::fitdist documentation, there are several waysto view thefitdist object, three of these including usingthe genericprint(),summary() andplot() functions. See the following examples for how toview some of the fitting information.
print(freq_analysis$Freq_Fitting$`7-Day`)Fitting of the distribution ' PIII ' by matching moments Parameters: estimateshape 21.71135693location 0.58975205scale -0.03836902summary(freq_analysis$Freq_Fitting$`7-Day`)Fitting of the distribution ' PIII ' by matching moments Parameters : estimateshape 21.71135693location 0.58975205scale -0.03836902Loglikelihood: 9.973448 AIC: -13.9469 BIC: -9.743303plot(freq_analysis$Freq_Fitting$`7-Day`)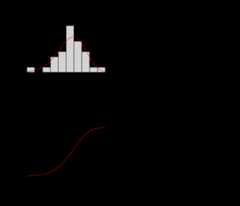
Whenplot_curve argument is set toTRUE(default) the computed frequency curves are plotted against the eventsdata in theFreq_Plot object:
freq_analysis<-compute_annual_frequencies(station_number="08NM116", roll_days=7, plot_curve=TRUE)freq_analysis$Freq_Plot
Fitted Quantiles
Based on the fitted distribution, flow events with specificprobabilities/return periods (quantiles) can be extracted from thecomputed curves. The desired quantiles are selected by listing theprobabilities in thefit_quantiles argument (defaults toc(.975, .99, .98, .95, .90, .80, .50, .20, .10, .05, .01),).The results are returned in theFreq_Fitted_Quantilestibble in the list. In the example below of the quantiles, the 7Q5 valuewould be the 7-day flow value with a 5-year return period, so 0.409 cmsin this example.
freq_analysis$Freq_Fitted_Quantiles Distribution Probability Return.Period X7.Day1 PIII 0.010 100.000000 0.19929622 PIII 0.050 20.000000 0.28326723 PIII 0.100 10.000000 0.33668304 PIII 0.200 5.000000 0.40952745 PIII 0.500 2.000000 0.57266586 PIII 0.800 1.250000 0.76221947 PIII 0.900 1.111111 0.86878358 PIII 0.950 1.052632 0.95909399 PIII 0.975 1.025641 1.038248610 PIII 0.980 1.020408 1.061844211 PIII 0.990 1.010101 1.1302692Notes on use of the Log-Pearson Type III Distribution
As noted, when using the"PIII" distribution infasstr, the provided data is log-transformed (log base 10usinglog10()) before being fit to a Pearson Type IIIdistribution. These log-transformed values are what are seen as the‘Data’ and ‘quantiles’ axes when plotting theFreq_Fittingfitdist objects (as seenabove). The resulting quantiles are then transformed back to theoriginal scale when computing the final quantiles returned in theFitted_Quantiles object and the plotted computed curvesin theFreq_Plot object. To use the natural log (usinglog()) instead of the base 10 log, setuse_log = TRUE. Since the log of zero or negative numberscannot be computed, data provided with these values (e.g. data withminimums of zero flow) will not be accepted into the functions.