Pennsylvania's 7th Congressional District


Pennsylvania's 7th Congressional District in theUnited States House of Representatives is represented byRyan Mackenzie (R).
As of the 2020 Census, Pennsylvania representatives represented an average of 765,403 residents. After the 2010 Census, each member represented 707,495 residents.
Pivot Counties
At the time of the 2018 election, this district intersected with one or morePivot Counties. These 206 Pivot Counties voted forDonald Trump (R) in 2016 after voting forBarack Obama (D) in 2008 and 2012.[1]
Elections
2024
See also: Pennsylvania's 7th Congressional District election, 2024
Pennsylvania's 7th Congressional District election, 2024 (April 23 Republican primary)
Pennsylvania's 7th Congressional District election, 2024 (April 23 Democratic primary)
General election
General election for U.S. House Pennsylvania District 7
Ryan Mackenzie defeated incumbentSusan Wild in the general election for U.S. House Pennsylvania District 7 on November 5, 2024.
Candidate | % | Votes | ||
| ✔ |  | Ryan Mackenzie (R) | 50.4 | 203,688 |
 | Susan Wild (D) | 49.4 | 199,626 | |
| Other/Write-in votes | 0.2 | 674 | ||
| Incumbents arebolded and underlined. The results have been certified. Source 1 Source 2 | Total votes: 403,988 | ||
| If you are a candidate and would like to tell readers and voters more about why they should vote for you,complete the Ballotpedia Candidate Connection Survey. | ||||
Do you want a spreadsheet of this type of data?Contact our sales team. | ||||
Withdrawn or disqualified candidates
- Lewis Shupe (Independent)
Democratic primary election
Democratic primary for U.S. House Pennsylvania District 7
IncumbentSusan Wild advanced from the Democratic primary for U.S. House Pennsylvania District 7 on April 23, 2024.
Candidate | % | Votes | ||
| ✔ | | Susan Wild | 98.2 | 55,259 |
| Other/Write-in votes | 1.8 | 989 | ||
| Incumbents arebolded and underlined. The results have been certified. Source 1 Source 2 | Total votes: 56,248 | ||
| If you are a candidate and would like to tell readers and voters more about why they should vote for you,complete the Ballotpedia Candidate Connection Survey. | ||||
Do you want a spreadsheet of this type of data?Contact our sales team. | ||||
Withdrawn or disqualified candidates
- Jenna Alwalah (D)
Republican primary election
Republican primary for U.S. House Pennsylvania District 7
Ryan Mackenzie defeatedKevin Dellicker andMaria Montero in the Republican primary for U.S. House Pennsylvania District 7 on April 23, 2024.
Candidate | % | Votes | ||
| ✔ | | Ryan Mackenzie | 42.4 | 23,557 |
 | Kevin Dellicker | 33.9 | 18,835 | |
 | Maria Montero | 23.3 | 12,952 | |
| Other/Write-in votes | 0.4 | 226 | ||
| There were noincumbents in this race. The results have been certified. Source 1 Source 2 | Total votes: 55,570 | ||
| If you are a candidate and would like to tell readers and voters more about why they should vote for you,complete the Ballotpedia Candidate Connection Survey. | ||||
Do you want a spreadsheet of this type of data?Contact our sales team. | ||||
Withdrawn or disqualified candidates
- Allen Issa (R)
2022
General election
General election for U.S. House Pennsylvania District 7
IncumbentSusan Wild defeatedLisa Scheller in the general election for U.S. House Pennsylvania District 7 on November 8, 2022.
Candidate | % | Votes | ||
| ✔ | | Susan Wild (D) | 51.0 | 151,364 |
 | Lisa Scheller (R) | 49.0 | 145,527 | |
| Incumbents arebolded and underlined. The results have been certified. Source | Total votes: 296,891 | ||
| If you are a candidate and would like to tell readers and voters more about why they should vote for you,complete the Ballotpedia Candidate Connection Survey. | ||||
Do you want a spreadsheet of this type of data?Contact our sales team. | ||||
Democratic primary election
Democratic primary for U.S. House Pennsylvania District 7
IncumbentSusan Wild advanced from the Democratic primary for U.S. House Pennsylvania District 7 on May 17, 2022.
Candidate | % | Votes | ||
| ✔ | | Susan Wild | 100.0 | 63,817 |
| Incumbents arebolded and underlined. The results have been certified. Source | Total votes: 63,817 | ||
| If you are a candidate and would like to tell readers and voters more about why they should vote for you,complete the Ballotpedia Candidate Connection Survey. | ||||
Do you want a spreadsheet of this type of data?Contact our sales team. | ||||
Withdrawn or disqualified candidates
- Tuong Tran (D)
Republican primary election
Republican primary for U.S. House Pennsylvania District 7
Lisa Scheller defeatedKevin Dellicker in the Republican primary for U.S. House Pennsylvania District 7 on May 17, 2022.
Candidate | % | Votes | ||
| ✔ | | Lisa Scheller | 51.3 | 34,504 |
| Kevin Dellicker | 48.7 | 32,713 | |
| There were noincumbents in this race. The results have been certified. Source | Total votes: 67,217 | ||
| If you are a candidate and would like to tell readers and voters more about why they should vote for you,complete the Ballotpedia Candidate Connection Survey. | ||||
Do you want a spreadsheet of this type of data?Contact our sales team. | ||||
Withdrawn or disqualified candidates
- Ryan Mackenzie (R)
2020
General election
General election for U.S. House Pennsylvania District 7
IncumbentSusan Wild defeatedLisa Scheller andAnthony Sayegh in the general election for U.S. House Pennsylvania District 7 on November 3, 2020.
Candidate | % | Votes | ||
| ✔ | | Susan Wild (D) | 51.9 | 195,475 |
| Lisa Scheller (R) | 48.1 | 181,407 | |
 | Anthony Sayegh (Independent) (Write-in) | 0.0 | 0 | |
| Incumbents arebolded and underlined. The results have been certified. Source | Total votes: 376,882 | ||
| If you are a candidate and would like to tell readers and voters more about why they should vote for you,complete the Ballotpedia Candidate Connection Survey. | ||||
Do you want a spreadsheet of this type of data?Contact our sales team. | ||||
Democratic primary election
Democratic primary for U.S. House Pennsylvania District 7
IncumbentSusan Wild advanced from the Democratic primary for U.S. House Pennsylvania District 7 on June 2, 2020.
Candidate | % | Votes | ||
| ✔ | | Susan Wild | 100.0 | 76,878 |
| Incumbents arebolded and underlined. The results have been certified. Source | Total votes: 76,878 | ||
| If you are a candidate and would like to tell readers and voters more about why they should vote for you,complete the Ballotpedia Candidate Connection Survey. | ||||
Do you want a spreadsheet of this type of data?Contact our sales team. | ||||
Withdrawn or disqualified candidates
- Darryl Hendricks (D)
Republican primary election
Republican primary for U.S. House Pennsylvania District 7
Lisa Scheller defeatedDean Browning in the Republican primary for U.S. House Pennsylvania District 7 on June 2, 2020.
Candidate | % | Votes | ||
| ✔ | | Lisa Scheller | 52.1 | 29,673 |
 | Dean Browning | 47.9 | 27,260 | |
| There were noincumbents in this race. The results have been certified. Source | Total votes: 56,933 | ||
| If you are a candidate and would like to tell readers and voters more about why they should vote for you,complete the Ballotpedia Candidate Connection Survey. | ||||
Do you want a spreadsheet of this type of data?Contact our sales team. | ||||
Withdrawn or disqualified candidates
- Matt Connolly (R)
2018
Results of 2018 redistricting
On February 19, 2018, thePennsylvania Supreme Court adopted a new congressional district map after ruling that the original map constituted an illegalpartisan gerrymander. District locations and numbers were changed by the new map. Candidates were listed under Pennsylvania’s new districts, which were used in the 2018 congressional elections. Clickhere for more information about the ruling.
The chart below compares this new district with the old district that was the most geographically similar to it.
| Old district[2] | Prior incumbent | Prior 2016 presidential result | New 2016 presidential result |
|---|---|---|---|
| 15th District | Charlie Dent (R) | R+7.6 | D+1.1 |
Not sure which district you're in?Find out here.
Click the box below to see how the new congressional districts compare to the ones in place before the redrawing.
Regular election
General election
General election for U.S. House Pennsylvania District 7
Susan Wild defeatedMarty Nothstein andTim Silfies in the general election for U.S. House Pennsylvania District 7 on November 6, 2018.
Candidate | % | Votes | ||
| ✔ | | Susan Wild (D) | 53.5 | 140,813 |
 | Marty Nothstein (R) | 43.5 | 114,437 | |
 | Tim Silfies (L) | 3.0 | 8,011 | |
| There were noincumbents in this race. The results have been certified. Source | Total votes: 263,261 | ||
| If you are a candidate and would like to tell readers and voters more about why they should vote for you,complete the Ballotpedia Candidate Connection Survey. | ||||
Do you want a spreadsheet of this type of data?Contact our sales team. | ||||
Democratic primary election
Democratic primary for U.S. House Pennsylvania District 7
The following candidates ran in the Democratic primary for U.S. House Pennsylvania District 7 on May 15, 2018.
Candidate | % | Votes | ||
| ✔ | | Susan Wild | 33.5 | 15,262 |
 | John Morganelli | 30.1 | 13,754 | |
 | Greg Edwards | 25.4 | 11,602 | |
| Roger Ruggles | 5.4 | 2,467 | ||
 | Rick Daugherty | 3.9 | 1,760 | |
| David Clark | 1.7 | 777 | ||

| There were noincumbents in this race. The results have been certified. | Total votes: 45,622 | ||
| If you are a candidate and would like to tell readers and voters more about why they should vote for you,complete the Ballotpedia Candidate Connection Survey. | ||||
Do you want a spreadsheet of this type of data?Contact our sales team. | ||||
Republican primary election
Republican primary for U.S. House Pennsylvania District 7
Marty Nothstein defeatedDean Browning in the Republican primary for U.S. House Pennsylvania District 7 on May 15, 2018.
Candidate | % | Votes | ||
| ✔ | | Marty Nothstein | 50.5 | 16,241 |
| Dean Browning | 49.5 | 15,923 | |
| There were noincumbents in this race. The results have been certified. | Total votes: 32,164 | ||
| If you are a candidate and would like to tell readers and voters more about why they should vote for you,complete the Ballotpedia Candidate Connection Survey. | ||||
Do you want a spreadsheet of this type of data?Contact our sales team. | ||||
Special election
General election
Special general election for U.S. House Pennsylvania District 7
Mary Gay Scanlon defeatedPearl Kim,Sandra Salas, andBrianna Johnston in the special general election for U.S. House Pennsylvania District 7 on November 6, 2018.
Candidate | % | Votes | ||
| ✔ |  | Mary Gay Scanlon (D) | 52.3 | 173,268 |
 | Pearl Kim (R) | 46.0 | 152,503 | |
 | Sandra Salas (L) | 1.0 | 3,177 | |
 | Brianna Johnston (G) | 0.8 | 2,511 | |
| There were noincumbents in this race. The results have been certified. Source | Total votes: 331,459 | ||
| If you are a candidate and would like to tell readers and voters more about why they should vote for you,complete the Ballotpedia Candidate Connection Survey. | ||||
Do you want a spreadsheet of this type of data?Contact our sales team. | ||||
2016
Heading into the election, Ballotpediarated this race as safely Republican. IncumbentPatrick Meehan (R) defeatedMary Ellen Balchunis (D) in the general election on November 8, 2016. Meehan defeatedStan Casacio in the Republican primary, while Balchunis defeatedBill Golderer to win the Democratic nomination. The primary elections took place on April 26, 2016.[8][9]
| Party | Candidate | Vote % | Votes | |
|---|---|---|---|---|
| Republican |  Patrick MeehanIncumbent Patrick MeehanIncumbent | 59.5% | 225,678 | |
| Democratic | Mary Ellen Balchunis | 40.5% | 153,824 | |
| Total Votes | 379,502 | |||
| Source:Pennsylvania Department of State | ||||
| Candidate | Vote % | Votes | ||
|---|---|---|---|---|
| Mary Ellen Balchunis | 74% | 52,792 | ||
| Bill Golderer | 26% | 18,509 | ||
| Total Votes | 71,301 | |||
| Source:Pennsylvania Department of State | ||||
| Candidate | Vote % | Votes | ||
|---|---|---|---|---|
| Patrick MeehanIncumbent | 76.4% | 86,178 | ||
| Stan Casacio | 23.6% | 26,674 | ||
| Total Votes | 112,852 | |||
| Source:Pennsylvania Department of State | ||||
2014
The 7th Congressional District of Pennsylvania held an election for theU.S. House of Representatives on November 4, 2014. IncumbentPatrick Meehan (R) defeatedMary Ellen Balchunis (D) in the general election.
| Party | Candidate | Vote % | Votes | |
|---|---|---|---|---|
| Republican | Patrick MeehanIncumbent | 62% | 145,869 | |
| Democratic | Mary Ellen Balchunis | 38% | 89,256 | |
| Total Votes | 235,125 | |||
| Source:Pennsylvania Department of State | ||||
2012
The 7th Congressional District of Pennsylvania held an election for theU.S. House of Representatives on November 6, 2012. IncumbentPatrick Meehan won re-election in the district.[10]
| Party | Candidate | Vote % | Votes | |
|---|---|---|---|---|
| Democratic | George Badey | 40.6% | 143,509 | |
| Republican | Patrick MeehanIncumbent | 59.4% | 209,942 | |
| Total Votes | 353,451 | |||
| Source:Pennsylvania Department of State "Official Election Results, 2012 General Election" | ||||
2010
On November 2, 2010, Patrick Meehan won election to theUnited States House. He defeated Bryan Lentz (D) and James D. Schneller (American Congress Party) in the general election.[11]
| U.S. House, Pennsylvania District 7 General Election, 2010 | ||||
|---|---|---|---|---|
| Party | Candidate | Vote % | Votes | |
| Republican | Patrick Meehan | 54.9% | 137,825 | |
| Democratic | Bryan Lentz | 44% | 110,314 | |
| American Congress Party | James D. Schneller | 1.1% | 2,708 | |
| Total Votes | 250,847 | |||
2008
On November 4, 2008, Joe Sestak won re-election to theUnited States House. He defeated W. Craig Williams (R) in the general election.[12]
| U.S. House, Pennsylvania District 7 General Election, 2008 | ||||
|---|---|---|---|---|
| Party | Candidate | Vote % | Votes | |
| Democratic | Joe Sestakincumbent | 59.6% | 209,955 | |
| Republican | W. Craig Williams | 40.4% | 142,362 | |
| Total Votes | 352,317 | |||
2006
On November 7, 2006, Joe Sestak won election to theUnited States House. He defeated Curt Weldon (R) and various write-in challengers in the general election.[13]
| U.S. House, Pennsylvania District 7 General Election, 2006 | ||||
|---|---|---|---|---|
| Party | Candidate | Vote % | Votes | |
| Democratic | Joe Sestak | 56.4% | 147,898 | |
| Republican | Curt Weldonincumbent | 43.6% | 114,426 | |
| N/A | Write-in | 0% | 110 | |
| Total Votes | 262,434 | |||
2004
On November 2, 2004, Curt Weldon won re-election to theUnited States House. He defeated Paul Scoles (D) and David Jahn (Libertarian) in the general election.[14]
| U.S. House, Pennsylvania District 7 General Election, 2004 | ||||
|---|---|---|---|---|
| Party | Candidate | Vote % | Votes | |
| Republican | Curt Weldonincumbent | 58.8% | 196,556 | |
| Democratic | Paul Scoles | 40.3% | 134,932 | |
| Libertarian | David Jahn | 0.9% | 3,039 | |
| Total Votes | 334,527 | |||
2002
On November 5, 2002, Curt Weldon won re-election to theUnited States House. He defeated Peter A. Lennon (D) in the general election.[15]
| U.S. House, Pennsylvania District 7 General Election, 2002 | ||||
|---|---|---|---|---|
| Party | Candidate | Vote % | Votes | |
| Republican | Curt Weldonincumbent | 66.1% | 146,296 | |
| Democratic | Peter A. Lennon | 33.9% | 75,055 | |
| Total Votes | 221,351 | |||
2000
On November 7, 2000, Curt Weldon won re-election to theUnited States House. He defeated Peter A. Lennon (D) in the general election.[16]
| U.S. House, Pennsylvania District 7 General Election, 2000 | ||||
|---|---|---|---|---|
| Party | Candidate | Vote % | Votes | |
| Republican | Curt Weldonincumbent | 64.8% | 172,569 | |
| Democratic | Peter A. Lennon | 35.2% | 93,687 | |
| Total Votes | 266,256 | |||
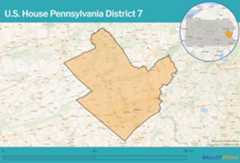
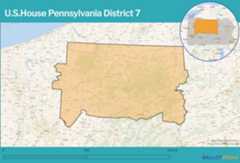
District map
Redistricting
2020-2021
On February 23, 2022, thePennsylvania Supreme Court ruled to enact a new congressional map.[17] Over a dozen maps were submitted to the supreme court, including the map approved by the legislature. The court ultimately selected the Carter map in a 4-3 ruling, which was submitted by a group of Pennsylvania citizens who were petitioners in a redistricting-related lawsuit. JusticesDebra Todd (D),Sallie Mundy (R), andKevin Brobson (R) dissented.[18]Spotlight PA's Kate Huangpu wrote that the map is "as similar as possible to the current congressional map, with nearly 90% of residents staying in the same district."[18] This map took effect for Pennsylvania's 2022 congressional elections.
The state supreme court took authority over the redistricting process after Gov.Tom Wolf (D) vetoed the legislature's enacted map on January 26.[19] ThePennsylvania House of Representatives voted to approve the initial map 110-91 on January 12, and thePennsylvania State Senate voted 29-20 to approve the map on January 24.[20][21] Following Wolf's veto, the authority for determining a new map initially rested with a lower court, but in a February 2 ruling the supreme court ruled that it would have control over the process to select a new congressional map.[22]
How does redistricting in Pennsylvania work? In Pennsylvania, the statutory authority to draw congressional district boundaries is vested with thePennsylvania General Assembly. These lines are subject to gubernatorial veto.[23]
State legislative district lines are drawn by a politician commission. Established in 1968, the commission comprises five members:[23]
- The majority leader of thePennsylvania State Senate appoints one member.
- The minority leader of thePennsylvania State Senate appoints one member.
- The majority leader of thePennsylvania House of Representatives appoints one member.
- The minority leader of thePennsylvania House of Representatives appoints one member.
- The first four commissioners appoint a fifth member to serve as the commission's chair. If the commission is unable to reach an agreement, thePennsylvania Supreme Court must appoint a commission chair.[23]
ThePennsylvania Constitution requires that state legislative districts be contiguous and compact. Further, state legislative districts should "respect county, city, incorporated town, borough, township and ward boundaries." There are no such requirements in place for congressional districts.[23]
2020
2024
2018
On January 22, 2018, the Pennsylvania Supreme Court struck down the state's congressional district map, finding that the map constituted an illegalpartisan gerrymander. On February 19, 2018, the court adopted a remedial map for use in the 2018 election cycle. Pennsylvania Republicans filed suit in federal district court to prevent implementation of the new map. The district court dismissed the suit on March 19, 2018. State Republicans also petitioned the Supreme Court of the United States to stay the state supreme court's order pending appeal. The court rejected this request on March 19, 2018. To learn more, seehere.
2010-2011

The Legislative Reapportionment Commission inPennsylvania approved the GOP-proposed map. It was signed into law on December 22, 2001.[24][25] On March 30, 2012, the 7th District was included in a list released by theNational Journal of the top ten most contorted congressional districts due to redistricting.[26]
District analysis
2026
Heading into the 2026 elections, based on results from the 2024 and 2020 presidential elections, theCook Partisan Voter Index for this district is R+1. This meant that in those two presidential elections, this district's results were 1 percentage points more Republican than the national average. This made Pennsylvania's 7th the 213th most Republican district nationally.[27]
2024
Heading into the 2024 elections, based on results from the 2020 and 2016 presidential elections, theCook Partisan Voter Index for this district was R+2. This meant that in those two presidential elections, this district's results were 2 percentage points more Republican than the national average. This made Pennsylvania's 7th the 212th most Republican district nationally.[28]
Daily Kos calculated what the results of the2020 presidential election in this district would have been followingredistricting.Joe Biden (D) would have defeatedDonald Trump (R) 49.7%-49.1%.[29]
2022
Heading into the 2022 elections, based on results from the 2020 and 2016 presidential elections, theCook Partisan Voter Index for this district was R+2. This meant that in those two presidential elections, this district's results were 2 percentage points more Republican than the national average. This made Pennsylvania's 7th the 211th most Republican district nationally.[30]
Daily Kos calculated what the results of the2020 presidential election in this district would have been followingredistricting.Joe Biden (D) would have received 49.7% of the vote in this district andDonald Trump (R) would have received 49.1%.[31]
2018
Heading into the 2018 elections, based on results from the 2016 and 2012 presidential elections, theCook Partisan Voter Index for this district was D+1. This meant that in those two presidential elections, this district's results were 1 percentage point more Democratic than the national average. This made Pennsylvania's 7th Congressional District the 194th most Democratic nationally.[32]
FiveThirtyEight's September 2018 elasticity score for states and congressional districts measured "how sensitive it is to changes in the national political environment." This district's elasticity score was 0.97. This means that for every 1 point the national political mood moved toward a party, the district was expected to move 0.97 points toward that party.[33]
See also
- Redistricting in Pennsylvania
- Pennsylvania's 7th Congressional District election, 2024
- Pennsylvania's 7th Congressional District election, 2022
- Pennsylvania's 7th Congressional District election, 2020
- Pennsylvania's 7th Congressional District election, 2018
External links
Footnotes
- ↑The raw data for this study was provided by Dave Leip ofAtlas of U.S. Presidential Elections.
- ↑2.02.1Refers to the old district that makes up a plurality of the new district.
- ↑The old 1st and 11th Districts did not make up a plurality of any of the new districts. The 1st District went for Hillary Clinton by 61.3 percentage points and was represented by Bob Brady (D). The 11th District went for Donald Trump by 23.8 percentage points and was represented by Lou Barletta (R).
- ↑District 13 incumbent Brendan Boyle (D) filed for re-election in the new 2nd District.
- ↑District 17 incumbent Matt Cartwright (D) filed for re-election in the new 8th District.
- ↑Lamb was elected in a March 2018 special election to replace Rep.Tim Murphy (R).
- ↑Lamb filed to run for PA-17 in the 2018 election.
- ↑Pennsylvania Department of State, "Unofficial Candidate Listing – Pre Ballot Lottery," accessed February 17, 2016
- ↑The New York Times, "Pennsylvania Primary Results," April 26, 2016
- ↑Politico, "2012 Election Map, Pennsylvania"
- ↑U.S. Congress House Clerk, "Statistics of the Congressional Election of November 2, 2010," accessed March 28, 2013
- ↑U.S. Congress House Clerk, "Statistics of the Congressional Election of November 4, 2008," accessed March 28, 2013
- ↑U.S. Congress House Clerk, "Statistics of the Congressional Election of November 7, 2006," accessed March 28, 2013
- ↑U.S. Congress House Clerk, "Statistics of the Congressional Election of November 2, 2004," accessed March 28, 2013
- ↑U.S. Congress House Clerk, "Statistics of the Congressional Election of November 5, 2002," accessed March 28, 2013
- ↑U.S. Congress House Clerk, "Statistics of the Congressional Election of November 7, 2000," accessed March 28, 2013
- ↑Pennsylvania Supreme Court, "Order," February 23, 2022
- ↑18.018.1Spotlight PA, "Pennsylvania Supreme Court picks congressional map put forth by state voters," February 23, 2022
- ↑Cite error: Invalid
<ref>tag; no text was provided for refs namedwtae - ↑Cite error: Invalid
<ref>tag; no text was provided for refs namedsen - ↑Cite error: Invalid
<ref>tag; no text was provided for refs namedhouse - ↑Cite error: Invalid
<ref>tag; no text was provided for refs namedpsc - ↑23.023.123.223.3All About Redistricting, "Pennsylvania," accessed May 8, 2015
- ↑ABC 27, "Corbett signs off on new congressional map," December 22, 2011
- ↑The Republic, "Senate Democrats and Chester County group plan to contest Pa. legislative redistricting plan," January 7, 2012
- ↑National Journal, "Modern Gerrymanders: 10 Most Contorted Congressional Districts—MAPS," accessed March 31, 2012
- ↑Cook Political Report, "2025 Cook PVI℠: District Map and List (119th Congress)," accessed July 1, 2025
- ↑Cook Political Report, "The 2022 Cook Partisan Voting Index (Cook PVI℠)," accessed January 10, 2024
- ↑Daily Kos, "Daily Kos Elections' 2020 presidential results by congressional district, for new and old districts," accessed September 15, 2022
- ↑Cook Political Report, "The 2022 Cook Partisan Voting Index (Cook PVI℠)," accessed February 6, 2023
- ↑Daily Kos, "Daily Kos Elections' 2020 presidential results by congressional district, for new and old districts," accessed September 15, 2022
- ↑Cook Political Report, "Introducing the 2017 Cook Political Report Partisan Voter Index," April 7, 2017
- ↑FiveThirtyEight, "Election Update: The Most (And Least) Elastic States And Districts," September 6, 2018

