Multi-Fidelity
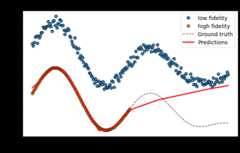
The following example is a 1D regression multi-fidelity issue. Blue points are low fidelity observations and orange points are high fidelity observations. The goal is to use both datasets to learn the task on the [0, 1] interval.
To tackle this challenge, we use here the parameter-based method:RegularTransferNN
[1]:
importnumpyasnpimportmatplotlib.pyplotaspltimportmatplotlib.animationasanimationfromsklearn.metricsimportmean_absolute_error,mean_squared_errorimporttensorflowastffromtensorflow.kerasimportModel,Sequentialfromtensorflow.keras.optimizersimportAdam,SGD,RMSprop,Adagradfromtensorflow.keras.layersimportDense,Input,Dropout,Conv2D,MaxPooling2D,Flatten,Reshape,GaussianNoise,BatchNormalizationfromtensorflow.keras.constraintsimportMinMaxNormfromtensorflow.keras.regularizersimportl2fromtensorflow.keras.callbacksimportCallbackfromtensorflow.keras.modelsimportclone_modelfromadapt.parameter_basedimportRegularTransferNN
Setup
[2]:
np.random.seed(0)Xs=np.linspace(0,1,200)ys=(1-Xs**2)*np.sin(2*2*np.pi*Xs)-Xs+0.1*np.random.randn(len(Xs))Xt=Xs[:100]yt=(1-Xt**2)*np.sin(2*2*np.pi*Xt)-Xt-1.5gt=(1-Xs**2)*np.sin(2*2*np.pi*Xs)-Xs-1.5
[3]:
plt.figure(figsize=(10,6))plt.plot(Xs,ys,'.',label="low fidelity",ms=15,alpha=0.9,markeredgecolor="black")plt.plot(Xt,yt,'.',label="high fidelity",ms=15,alpha=0.9,markeredgecolor="black")plt.plot(Xs,gt,c="black",alpha=0.7,ls="--",label="Ground truth")plt.legend(fontsize=14)plt.xlabel("X",fontsize=16)plt.ylabel("y = f(X)",fontsize=16)plt.show()

Network
[4]:
np.random.seed(0)tf.random.set_seed(0)model=Sequential()model.add(Dense(100,activation='relu',input_shape=(1,)))model.add(Dense(100,activation='relu'))model.add(Dense(1))model.compile(optimizer=Adam(0.001),loss='mean_squared_error')
Low fidelity only
[5]:
np.random.seed(0)tf.random.set_seed(0)model_low=clone_model(model)model_low.compile(optimizer=Adam(0.001),loss='mean_squared_error')model_low.fit(Xs,ys,epochs=800,batch_size=34,verbose=0);
[6]:
yp=model_low.predict(Xs.reshape(-1,1))score=mean_absolute_error(gt.ravel(),yp.ravel())plt.figure(figsize=(10,6))plt.plot(Xs,ys,'.',label="low fidelity",ms=15,alpha=0.9,markeredgecolor="black")plt.plot(Xt,yt,'.',label="high fidelity",ms=15,alpha=0.9,markeredgecolor="black")plt.plot(Xs,gt,c="black",alpha=0.7,ls="--",label="Ground truth")plt.plot(Xs,yp,c="red",alpha=0.9,lw=3,label="Predictions")plt.legend(fontsize=14)plt.xlabel("X",fontsize=16)plt.ylabel("y = f(X)",fontsize=16)plt.title("Low Fidelity Only -- MAE =%.3f"%score,fontsize=18)plt.show()

High fidelity only
[7]:
np.random.seed(0)tf.random.set_seed(0)model_high=clone_model(model)model_high.compile(optimizer=Adam(0.001),loss='mean_squared_error')model_high.fit(Xt,yt,epochs=800,batch_size=34,verbose=0);
[8]:
yp=model_high.predict(Xs.reshape(-1,1))score=mean_absolute_error(gt.ravel(),yp.ravel())plt.figure(figsize=(10,6))plt.plot(Xs,ys,'.',label="low fidelity",ms=15,alpha=0.9,markeredgecolor="black")plt.plot(Xt,yt,'.',label="high fidelity",ms=15,alpha=0.9,markeredgecolor="black")plt.plot(Xs,gt,c="black",alpha=0.7,ls="--",label="Ground truth")plt.plot(Xs,yp,c="red",alpha=0.9,lw=3,label="Predictions")plt.legend(fontsize=14)plt.xlabel("X",fontsize=16)plt.ylabel("y = f(X)",fontsize=16)plt.title("Low Fidelity Only -- MAE =%.3f"%score,fontsize=18)plt.show()
RegularTransferNN
[10]:
model_reg=RegularTransferNN(model_low,lambdas=1000.,random_state=1,optimizer=Adam(0.0001))model_reg.fit(Xt.reshape(-1,1),yt,epochs=1200,batch_size=34,verbose=0);
WARNING:tensorflow:Gradients do not exist for variables ['Variable:0'] when minimizing the loss.WARNING:tensorflow:Gradients do not exist for variables ['Variable:0'] when minimizing the loss.
[11]:
yp=model_reg.predict(Xs.reshape(-1,1))score=mean_absolute_error(gt.ravel(),yp.ravel())plt.figure(figsize=(10,6))plt.plot(Xs,ys,'.',label="low fidelity",ms=15,alpha=0.9,markeredgecolor="black")plt.plot(Xt,yt,'.',label="high fidelity",ms=15,alpha=0.9,markeredgecolor="black")plt.plot(Xs,gt,c="black",alpha=0.7,ls="--",label="Ground truth")plt.plot(Xs,yp,c="red",alpha=0.9,lw=3,label="Predictions")plt.legend(fontsize=14)plt.xlabel("X",fontsize=16)plt.ylabel("y = f(X)",fontsize=16)plt.title("Low Fidelity Only -- MAE =%.3f"%score,fontsize=18)plt.show()
