
An official website of the United States government

The .gov means it’s official.
Federal government websites often end in .gov or .mil. Before sharing sensitive information, make sure you’re on a federal government site.

The site is secure.
Thehttps:// ensures that you are connecting to the official website and that any information you provide is encrypted and transmitted securely.
The Heart of America’s February Climate
")
From sunny warmth to sub-zero cold blasts, high variability is at the heart of U.S. climate conditions during February. One of the highlights of the month, the tradition of Valentine’s Day, isn’t exactly set up with the ideal climate for Cupid to be out and about across the country. Across the Lower 48 on February 14, normal high temperatures typically range from the 70s to the 20s and normal lows typically range from the 60s to below 0. In honor of Valentine’s Day, NCEI took a look at typical February climate conditions and normals for several lovely U.S. locations.
February U.S. Climate Conditions
It’s not just Valentine’s Day that often sees drastically different weather conditions from year-to-year. Throughout February we often endure atmospheric swings asmeteorological winter comes to a close in the Northern Hemisphere.
Temperatures
Climatologically speaking, February is the third coldest month of the year—with December and January typically being colder. Despite this, areas around the Great Lakes typically see theircoldest days in February, according to the updated 1990–2020U.S. Climate Normals. The contiguous U.S. average temperature is around 34°F for the month, based on data from the 132-year record in the U.S.
Thecoldest February on record for the Lower 48 occurred in 1936 when the average temperature for the contiguous U.S. was a frigid 25.2°F. During that month every state except Utah had a temperature near or below the 20th-century average. Eight states across the Northwest and Northern Plains were record cold. The statewideaverage temperature for North Dakota was a bone-chilling 14.1°F below zero, 26.0°F below average—and the average nighttime temperature for the state was a whopping 23.4°F below zero. February 1936 is the coldest month of any month on record for North Dakota. And, North Dakota’s average temperature of −14.1°F that month remains the all-time coldest monthly temperature for any state in our 132-year period of record.

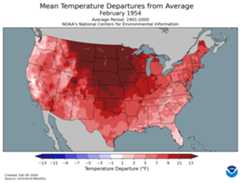
Conversely, the contiguous U.S. saw itswarmest February on record in 1954 with an average temperature of 41.4°F. Every state in the lower 48 was warmer than average in February 1954, and six states across the Great Plains were record warm. The warmest state, when compared to its own history, was North Dakota with a temperature 17.7°F above average—43.7°F warmer than its coldest February in 1936.
Since 1895, the contiguous U.S. temperature for February has increased at a rate of 3.0°F per century. When looking at the country’s entire period of record, February is warming faster than any other month of the year.
Snow Cover
During an average February, 1.2 million square miles of the contiguous U.S.—about 4.5 times the size of Texas—is covered in snow. Since 1967, the year when satellite records began, the largest February snow cover extent for the Lower 48 occurred in 1978. That month, 1.9 million square miles or 64% of the contiguous U.S. was covered in snow. The smallest February snow cover extent for the Lower 48 occurred in 1992 when just 0.8 million square miles or 29% of the contiguous U.S. was covered in snow.
According to theRegional Snowfall Index, several large snow storms have impacted the U.S. during February. Some of thesehistoric storms include:
- The Valentine’s Day Storm of 1940
- The Great Blizzard of 1978
- The Presidents’ Day Snowstorm of 1979
- The Megalopolitan Storm of 1983
- The Presidents’ Day Blizzard of 2003
- The Valentine’s Day Blizzard of 2007
- The Groundhog Day Blizzard of 2011

Tornadoes
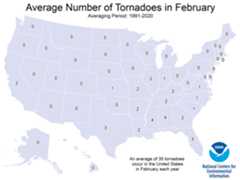
Tornado activity varies widely during February, with some years seeing a very active month and others experiencing few events. The most active February occurred in2008 when the country had 147 confirmed tornado reports. The least active February occurred in both1982 and 2010, when only one tornado was reported each year.
February 14 Climate Normals for Swoonworthy U.S. Locations
In such a geographically and climatologically diverse country, average conditions can vary from day to day and from place to place across the U.S. From Kissimmee’s warmth to frigid Wildrose, the graphic below shows the normal average temperature of locations with 16 Valentine-themed names on February 14, according to our daily1991–2020 Climate Normals data.

While our Climate Normals provide average temperatures throughout the U.S., the actual conditions this Valentine’s Day may vary widely based on weather and climate patterns. For prediction of your actual local daily temperature, check out your local forecast office onweather.gov.
Published
Updated with information that reflects current data and new Climate Normals (1991-2020) and an updated map.
Related Links
Related News
")
February 12, 2026
The Heart of America’s February Climate

January 30, 2026
What Will Punxsutawney Phil’s Six-Week Weather Prediction Be?

September 25, 2025