Dynamic Correlation Analysis Method of Air Pollutants in Spatio-Temporal Analysis
- PMID:31948076
- PMCID: PMC6981785
- DOI: 10.3390/ijerph17010360
Dynamic Correlation Analysis Method of Air Pollutants in Spatio-Temporal Analysis
Abstract
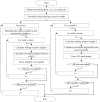
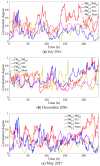
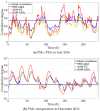
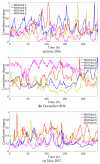
Pollutant analysis and pollution source tracing are critical issues in air quality management, in which correlation analysis is important for pollutant relation modeling. A dynamic correlation analysis method was proposed to meet the real-time requirement in atmospheric management. Firstly, the spatio-temporal analysis framework was designed, in which the process of data monitoring, correlation calculation, and result presentation were defined. Secondly, the core correlation calculation method was improved with an adaptive data truncation and grey relational analysis. Thirdly, based on the general framework and correlation calculation, the whole algorithm was proposed for various analysis tasks in time and space, providing the data basis for ranking and decision on pollutant effects. Finally, experiments were conducted with the practical data monitored in an industrial park of Hebei Province, China. The different pollutants in multiple monitoring stations were analyzed crosswise. The dynamic features of the results were obtained to present the variational correlation degrees from the proposed and contrast methods. The results proved that the proposed dynamic correlation analysis could quickly acquire atmospheric pollution information. Moreover, it can help to deduce the influence relation of pollutants in multiple locations.
Keywords: air pollution management; correlation degree; pollutant source tracing; spatio-temporal analysis.
Conflict of interest statement
The authors declare no conflict of interest.
Figures






Similar articles
- The impact of the congestion charging scheme on air quality in London. Part 1. Emissions modeling and analysis of air pollution measurements.Kelly F, Anderson HR, Armstrong B, Atkinson R, Barratt B, Beevers S, Derwent D, Green D, Mudway I, Wilkinson P; HEI Health Review Committee.Kelly F, et al.Res Rep Health Eff Inst. 2011 Apr;(155):5-71.Res Rep Health Eff Inst. 2011.PMID:21830496
- The Functional Spatio-Temporal Statistical Model with Application to O3 Pollution in Beijing, China.Wang Y, Xu K, Li S.Wang Y, et al.Int J Environ Res Public Health. 2020 May 2;17(9):3172. doi: 10.3390/ijerph17093172.Int J Environ Res Public Health. 2020.PMID:32370183Free PMC article.
- LaSVM-based big data learning system for dynamic prediction of air pollution in Tehran.Ghaemi Z, Alimohammadi A, Farnaghi M.Ghaemi Z, et al.Environ Monit Assess. 2018 Apr 20;190(5):300. doi: 10.1007/s10661-018-6659-6.Environ Monit Assess. 2018.PMID:29679160Free PMC article.
- A critical evaluation of air quality index models (1960-2021).K P, Kumar P.K P, et al.Environ Monit Assess. 2022 Apr 1;194(4):324. doi: 10.1007/s10661-022-09896-8.Environ Monit Assess. 2022.PMID:35359193Review.
- Design of an Air Pollution Monitoring Campaign in Beijing for Application to Cohort Health Studies.Vedal S, Han B, Xu J, Szpiro A, Bai Z.Vedal S, et al.Int J Environ Res Public Health. 2017 Dec 15;14(12):1580. doi: 10.3390/ijerph14121580.Int J Environ Res Public Health. 2017.PMID:29244738Free PMC article.Review.
Cited by
- Construction and Drug Evaluation Based on Convolutional Neural Network System Optimized by Grey Correlation Analysis.Teng H.Teng H.Comput Intell Neurosci. 2021 Sep 15;2021:2794588. doi: 10.1155/2021/2794588. eCollection 2021.Comput Intell Neurosci. 2021.Retraction in:Comput Intell Neurosci. 2023 Aug 2;2023:9787835. doi: 10.1155/2023/9787835.PMID:34567098Free PMC article.Retracted.
- The New Trend of State Estimation: From Model-Driven to Hybrid-Driven Methods.Jin XB, Robert Jeremiah RJ, Su TL, Bai YT, Kong JL.Jin XB, et al.Sensors (Basel). 2021 Mar 16;21(6):2085. doi: 10.3390/s21062085.Sensors (Basel). 2021.PMID:33809743Free PMC article.Review.
- Deep Prediction Model Based on Dual Decomposition with Entropy and Frequency Statistics for Nonstationary Time Series.Shi Z, Bai Y, Jin X, Wang X, Su T, Kong J.Shi Z, et al.Entropy (Basel). 2022 Mar 2;24(3):360. doi: 10.3390/e24030360.Entropy (Basel). 2022.PMID:35327871Free PMC article.
- Assessment of the Construction of a Climate Resilient City: An Empirical Study Based on the Difference in Differences Model.Liang Z.Liang Z.Int J Environ Res Public Health. 2021 Feb 21;18(4):2082. doi: 10.3390/ijerph18042082.Int J Environ Res Public Health. 2021.PMID:33669915Free PMC article.
- An Acceleration Based Fusion of Multiple Spatiotemporal Networks for Gait Phase Detection.Zhen T, Yan L, Kong JL.Zhen T, et al.Int J Environ Res Public Health. 2020 Aug 5;17(16):5633. doi: 10.3390/ijerph17165633.Int J Environ Res Public Health. 2020.PMID:32764244Free PMC article.
References
- Hopke P.K., Ito K., Mar T., Christensen W.F., Eatough D.J., Henry R.C., Kim E., Laden F., Lall R., Larson T.V., et al. PM source apportionment and health effects: 1. Intercomparison of source apportionment results. J. Expo. Sci. Environ. Epidemiol. 2006;16:275. doi: 10.1038/sj.jea.7500458. - DOI - PubMed
- Shang X., Li Y., Pan Y., Liu R.F., Lai Y.P. Modification and application of gaussian plume model for an industrial transfer park. Adv. Mater. Res. 2013;785:1384–1387. doi: 10.4028/www.scientific.net/AMR.785-786.1384. - DOI
Publication types
MeSH terms
Substances
LinkOut - more resources
Full Text Sources
Medical
