Movatterモバイル変換


[0]ホーム

URL:


Skip to main page content
U.S. flag

An official website of the United States government

Dot gov

The .gov means it’s official.
Federal government websites often end in .gov or .mil. Before sharing sensitive information, make sure you’re on a federal government site.

Https

The site is secure.
Thehttps:// ensures that you are connecting to the official website and that any information you provide is encrypted and transmitted securely.

NIH NLM Logo
Log inShow account info
Access keysNCBI HomepageMyNCBI HomepageMain ContentMain Navigation
pubmed logo
Advanced Clipboard
User Guide

Full text links

HighWire full text link HighWire Free PMC article
Full text links

Actions

Share

.2014 May 7;34(19):6459-69.
doi: 10.1523/JNEUROSCI.3414-13.2014.

Hippocampal replay captures the unique topological structure of a novel environment

Affiliations

Hippocampal replay captures the unique topological structure of a novel environment

Xiaojing Wu et al. J Neurosci..

Abstract

Hippocampal place-cell replay has been proposed as a fundamental mechanism of learning and memory, which might support navigational learning and planning. An important hypothesis of relevance to these proposed functions is that the information encoded in replay should reflect the topological structure of experienced environments; that is, which places in the environment are connected with which others. Here we report several attributes of replay observed in rats exploring a novel forked environment that support the hypothesis. First, we observed that overlapping replays depicting divergent trajectories through the fork recruited the same population of cells with the same firing rates to represent the common portion of the trajectories. Second, replay tended to be directional and to flip the represented direction at the fork. Third, replay-associated sharp-wave-ripple events in the local field potential exhibited substructure that mapped onto the maze topology. Thus, the spatial complexity of our recording environment was accurately captured by replay: the underlying neuronal activities reflected the bifurcating shape, and both directionality and associated ripple structure reflected the segmentation of the maze. Finally, we observed that replays occurred rapidly after small numbers of experiences. Our results suggest that hippocampal replay captures learned information about environmental topology to support a role in navigation.


Figures

Figure 1.
Figure 1.
Place-cell activities in modified Y maze.A, Modified Y maze.B An example epoch of 106 s of recording. Top, Linearized running trajectory of Rat 1. Horizontal dashed lines indicate arm boundaries. Colored arrows on right indicate arm alignment along linear axis (same below). The rat ran through center → C → center → R → center → L → center. Middle, Simultaneously recorded spike trains from 88 putative place cells, ordered by locations of the peak firing rates of the cells on linearized maze. Bottom, Position estimation based on these spikes, where posterior probabilities of position representations in each 250 ms window were indicated by a hot scale.C, Illustration of definition of trajectory-specific subregions within a candidate event for replay detection. An example candidate event (left) was first segmented in position into three segments, with each one corresponding to an individual arm: center top, the L arm; center middle, the R arm; and center bottom, the C arm. Blue curves are MAP functions, defined as the largest posterior probability across all positions per time bin, and calculated separately for each segment. Vertical dashed lines indicate the windows within which MAPs were above the threshold (1/total number of position bins) × 5, which is marked by red lines, thus defining trajectory-specific subregions for the three single-arm segments. In this example, only C and R subregions passed all criteria for containing replay structure, which were combined to define the subregion for the joint-arm path CR (right). This candidate event was finally determined to contain a joint replay of CR.
Figure 2.
Figure 2.
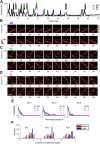
Joint replays were detected from neuronal data in significant numbers.A, Linearized position as a function of time for Rat 1 during first exposure to the modified Y maze. Colored ticks mark when and where example replays inB,C, andD occurred.B,C,D, Examples of identified replay events representing CR, RL, and CL trajectories from a single rat (Rat 1), in which the position is decoded from neuronal spike trains in nonoverlapping 10 ms bins. Horizontal dashed lines mark arm boundaries. Replays in each row are ordered by the time of occurrence. The duration of each event (in milliseconds) is shown below each example.E, For each pair of joint arms, the probability of observing the number of identified joint replays by chance is expressed as the distribution of the numbers of replays representing the same joint arms sampled from 5000 shuffles as fractions of the number of joint replays actually observed (numbers in inset). Each type of replay from each animal was highly significant.F, Histograms of fractions of candidate event time windows occupied by single-arm replays and joint replays are plotted for each animal, normalized by the total numbers of replays. Single-arm replays (0.6 ± 0.0 across all rats) occupied significantly smaller fractions of spike density events than joint replays (0.8 ± 0.0 across all rats; Rat 1:t(755) = −14.6;p < 10−42; Rat 2:t(385) = −5.8;p < 10−7; Rat 3:t(267) = −10.1;p < 0.02).
Figure 3.
Figure 3.
The same group of cells fired during common segments of joint replays.A,B, Two hypotheses of how joint replays might be encoded.A, Three independent populations of place cells with three separate sequences of place fields on the Y maze. Each pair of joint arms is encoded by a separate sequence.B, Joint replays were generated by a neuronal network that captures the spatial structure of the Y maze. The common segment of each pair of joint replays is generated by two different groups of cells inA and the same group of cells inB.C, Mean firing rates of cells from Rat 1 during the common segment C of joint CR (blue) and CL (magenta) replays. The included cells fired at least one spike during the C part of at least one CR or CL replay. Note that firing rates for the two replay types are highly similar across cells.D,E,F, Solid curves show cumulative distributions of absolute differences between the mean firing rates of cells during the common segments of paired joint replays (e.g., the blue and magenta curves inC). Dashed curves show distributions calculated from 5000 shuffles in which replay types (e.g., CR and CL) were randomized.
Figure 4.
Figure 4.
Joint replay directionality.A, The junction of the three arms is the choice point. Running toward the choice point is “inbound,” and running away is “outbound.”B–E, Examples of joint replay with different combinations of directionalities from Rat 1. Horizontal dashed lines indicate arm boundaries. Black diamond shapes mark the location of the rat when each replay occurred. The color scale is set so that maximally saturated colors correspond to the largest position probability of each replay.B, A consistent reverse replay of CR.C, A consistent forward replay of RL.D, A CR replay with a reverse C segment followed by a forward R segment.E, An RL replay with a reverse R segment followed by a mixed L segment.F, Each bar shows, for all joint replays with at least one directional segment identified during each stopping period, the percentage of the first segments (top) or the second segments (bottom) with each directionality type (see legend). The joint replay number and location of each stopping period are shown in the overbar. Data are from Rat 1.G, Percentages calculated for all stopping periods combined, for the three rats separately. The total number of joint replays (with at least one directional segment) is shown in each bar plot for each rat. For each of the three rats, it was found that first segments were significantly more reverse than forward: Rat 1: reverse, 0.58 ± 0.06; forward, 0.13 ± 0.05;t(52) = 6.0;p < 10−6; Rat 2: reverse, 0.67 ± 0.11; forward, 0;t(16) = 6.1;p < 10−4; Rat 3: reverse, fraction of reverse play = 0.77 ± 0.07; forward, 0.05 ± 0.04;t(52) = 9.1;p < 10−11. For each of the three rats, it was also found that the second segments were significantly more forward than reverse: Rat 1: reverse, 0.11 ± 0.03; forward, 0.44 ± 0.06;t(52) = −5.2;p < 10−5; Rat 2: reverse, 0.01 ± 0.01; forward, 0.47 ± 0.11;t(16) = −4.3;p < 10−3; Rat 3: reverse, 0.00 ± 0.00; forward, 0.63 ± 0.08;t(52) = −7.5;p < 10−9.
Figure 5.
Figure 5.
Joint replays were associated with multiple ripples. The number of ripples detected during each joint replay (during the joint trajectory-specific subregion) was plotted against the duration (subregion length) of each replay, with each replay type plotted in a different color. For visualization purpose only, random noise was added to ripple numbers. Horizontal lines on left indicate mean ripple numbers. Histograms of replay durations are shown at bottom. Diagonal lines show linear regressions based on each replay type.
Figure 6.
Figure 6.
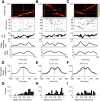
Ripples specifically co-occurred with arm representations.A–C, Examples from Rat 1. Top to bottom, Decoded joint replays of CR, CL, and RL; place-cell spikes during replay with cells ordered by locations of their peak firing rates on linearized track; raw LFP recording from one selected tetrode channel; ripple amplitude; multiunit spike density as a function of time. In all panels, the vertical dashed lines at the center indicate the time of choice-point representation during replay, which inB were moved to the left by two bins (20 ms) for illustration purposes solely.D–F, Ripple amplitude traces (e.g., those shown inA–C) of all joint replays, each normalized to its own maximum amplitude, were each aligned to the time when the choice point was represented during replay (0 ms in each panel, indicated by vertical black lines). They were also reoriented to the same joint-arm directions noted in captions (e.g., traces of R → C replays were all flipped around 0 ms). Mean ± SEM values of the resulting traces across all three rats are shown for each replay type.G–I, Histograms of the ratios of ripple amplitude at 0 ms to mean of peak ripple amplitudes on either side of 0 ms.
Figure 7.
Figure 7.
Joint replays reached significant numbers rapidly.A, The first 10 stopping periods of Rat 1 (recorded position). The numbers of candidate events found during each stopping period are noted next to the stopping periods. Red letters indicate the stopping periods by which the noted types of replay first reached significant numbers.B–D, Each panel demonstrates how the number of observed replays outgrows those counted from shuffles (data from Rat 1). Dotted black lines, Cumulative numbers of replays detected from the original data. Gray shadings, Mean ± SD of cumulative numbers of replays of the same type detected from 5000 sets of shuffled data. Colored dotted lines, Monte Carlop values of the original cumulative numbers: blue,p ≥ 0.05 (not significant); red,p < 0.05 (significant). The numbers of laps run on corresponding joint-arms before the first significant stopping periods are noted in titles.E–J, Results for Rats 2 and 3 are shown inE–G andH–J.
See this image and copyright information in PMC

Comment in

Similar articles

See all similar articles

Cited by

See all "Cited by" articles

References

    1. Buckner RL. The role of the hippocampus in prediction and imagination. Annu Rev Psychol. 2010;61:27–48. C1–C8. doi: 10.1146/annurev.psych.60.110707.163508. - DOI - PubMed
    1. Buzsáki G. Two-stage model of memory trace formation: a role for “noisy” brain states. Neuroscience. 1989;31:551–570. doi: 10.1016/0306-4522(89)90423-5. - DOI - PubMed
    1. Carr MF, Jadhav SP, Frank LM. Hippocampal replay in the awake state: a potential substrate for memory consolidation and retrieval. Nat Neurosci. 2011;14:147–153. doi: 10.1038/nn.2732. - DOI - PMC - PubMed
    1. Csicsvari J, O'Neill J, Allen K, Senior T. Place-selective firing contributes to the reverse-order reactivation of CA1 pyramidal cells during sharp waves in open-field exploration. Eur J Neurosci. 2007;26:704–716. doi: 10.1111/j.1460-9568.2007.05684.x. - DOI - PMC - PubMed
    1. Davidson TJ, Kloosterman F, Wilson MA. Hippocampal replay of extended experience. Neuron. 2009;63:497–507. doi: 10.1016/j.neuron.2009.07.027. - DOI - PMC - PubMed

Publication types

MeSH terms

Grants and funding

LinkOut - more resources

Full text links
HighWire full text link HighWire Free PMC article
Cite
Send To

NCBI Literature Resources

MeSHPMCBookshelfDisclaimer

The PubMed wordmark and PubMed logo are registered trademarks of the U.S. Department of Health and Human Services (HHS). Unauthorized use of these marks is strictly prohibited.


[8]ページ先頭

©2009-2025 Movatter.jp