FUBAR: a fast, unconstrained bayesian approximation for inferring selection
- PMID:23420840
- PMCID: PMC3670733
- DOI: 10.1093/molbev/mst030
FUBAR: a fast, unconstrained bayesian approximation for inferring selection
Abstract
Model-based analyses of natural selection often categorize sites into a relatively small number of site classes. Forcing each site to belong to one of these classes places unrealistic constraints on the distribution of selection parameters, which can result in misleading inference due to model misspecification. We present an approximate hierarchical Bayesian method using a Markov chain Monte Carlo (MCMC) routine that ensures robustness against model misspecification by averaging over a large number of predefined site classes. This leaves the distribution of selection parameters essentially unconstrained, and also allows sites experiencing positive and purifying selection to be identified orders of magnitude faster than by existing methods. We demonstrate that popular random effects likelihood methods can produce misleading results when sites assigned to the same site class experience different levels of positive or purifying selection--an unavoidable scenario when using a small number of site classes. Our Fast Unconstrained Bayesian AppRoximation (FUBAR) is unaffected by this problem, while achieving higher power than existing unconstrained (fixed effects likelihood) methods. The speed advantage of FUBAR allows us to analyze larger data sets than other methods: We illustrate this on a large influenza hemagglutinin data set (3,142 sequences). FUBAR is available as a batch file within the latest HyPhy distribution (http://www.hyphy.org), as well as on the Datamonkey web server (http://www.datamonkey.org/).
Figures

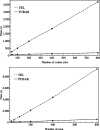
 ) are continuous model parameters that vary from one site to another, illustrated by a hypothetical distribution in (A). Typical random effects models, as exemplified by Dual REL (Kosakovsky Pond and Muse 2005) in (B) use a small number of discrete categories to approximate this continuous distribution, allowing the location (represented by the green bars) and the probability mass of the discrete points to vary; a change in the location of a point necessitates a re-evaluation of the phylogenetic likelihood function. FUBAR, in (C), uses a much denser grid of values chosen a priori, relying on the grid density to circumvent the need to move the parameter locations, and on MCMC to sample the weights assigned to each point. Without the need for movable grid lines, FUBAR needs to compute the conditional likelihood associated with each point only once, eliminating the bottleneck hindering traditional random effects models. Note that the uniform grid spacing depicted here is stylized. As the uncertainty in the selection parameters grows with their magnitude, FUBAR uses larger spacing for larger values (see text for details).

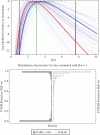
 for a set of simulated sites (see text for description). Vertical lines indicate the value
 under which the sites were simulated, along with the values for the neutral and positive selection site categories (
 and
and , respectively) used by the M2a model in PAML. The value of the positive selection site category does not match that under which the sites were simulated, due to the presence of other sites under stronger positive selection. The only evidence considered by M2a when classifying a site into the neutral or positive selection category is the value of the likelihood function at
 and the value at
 . With the peaks of the likelihood functions between these options, the model becomes overconfident, assigning strong evidence either for positive selection (exemplified by the blue curve) or against it (exemplified by the red curve), even when this conclusion is incorrect. (Bottom) Histograms of posterior site-specific probabilities of positive selection calculated for sites simulated under a true
 . M2a (left) confidently identifies positive selection in nearly half of these sites, but also incorrectly declares strong evidence against positive selection in half. FUBAR (right) detects most of the sites, and does not claim strong evidence for incorrect conclusions.
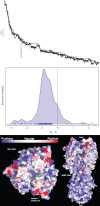
 across H3, with the greatest density at mild purifying selection
 , and fewer sites under positive selection
 . The notches depict sites with posteriors greater than 0.9 for positive (red) or purifying (blue) selection. (Bottom) The inferred
 values mapped to the HA protein (PDB 3ZTJ; Corti et al. 2011), displayed from two viewpoints. Red regions with stronger diversifying selection are likely involved in immune escape. These primarily occur on the “head” of the protein, with mostly purifying selection on the membrane proximal stem. See text for further detail.
Similar articles
- bModelTest: Bayesian phylogenetic site model averaging and model comparison.Bouckaert RR, Drummond AJ.Bouckaert RR, et al.BMC Evol Biol. 2017 Feb 6;17(1):42. doi: 10.1186/s12862-017-0890-6.BMC Evol Biol. 2017.PMID:28166715Free PMC article.
- Bayesian random local clocks, or one rate to rule them all.Drummond AJ, Suchard MA.Drummond AJ, et al.BMC Biol. 2010 Aug 31;8:114. doi: 10.1186/1741-7007-8-114.BMC Biol. 2010.PMID:20807414Free PMC article.
- Phylogenetic MCMC algorithms are misleading on mixtures of trees.Mossel E, Vigoda E.Mossel E, et al.Science. 2005 Sep 30;309(5744):2207-9. doi: 10.1126/science.1115493.Science. 2005.PMID:16195459
- Identifiability of parameters in MCMC Bayesian inference of phylogeny.Rannala B.Rannala B.Syst Biol. 2002 Oct;51(5):754-60. doi: 10.1080/10635150290102429.Syst Biol. 2002.PMID:12396589
- Markov chain Monte Carlo inference for Markov jump processes via the linear noise approximation.Stathopoulos V, Girolami MA.Stathopoulos V, et al.Philos Trans A Math Phys Eng Sci. 2012 Dec 31;371(1984):20110541. doi: 10.1098/rsta.2011.0541. Print 2013 Feb 13.Philos Trans A Math Phys Eng Sci. 2012.PMID:23277599
Cited by
- Phylogenetic Inference of the 2022 Highly Pathogenic H7N3 Avian Influenza Outbreak in Northern Mexico.Navarro-Lopez R, Xu W, Gomez-Romero N, Velazquez-Salinas L, Berhane Y.Navarro-Lopez R, et al.Pathogens. 2022 Nov 1;11(11):1284. doi: 10.3390/pathogens11111284.Pathogens. 2022.PMID:36365034Free PMC article.
- The strength of selection is consistent across both domains of the MHC class I peptide-binding groove in birds.Minias P, He K, Dunn PO.Minias P, et al.BMC Ecol Evol. 2021 May 8;21(1):80. doi: 10.1186/s12862-021-01812-x.BMC Ecol Evol. 2021.PMID:33964878Free PMC article.
- Whole genome characteristics of hedgehog coronaviruses from Poland and analysis of the evolution of the Spike protein for its interspecies transmission potential.Domanska-Blicharz K, Lisowska A, Opolska J, Ruszkowski JJ, Gogulski M, Pomorska-Mól M.Domanska-Blicharz K, et al.BMC Vet Res. 2024 Sep 21;20(1):424. doi: 10.1186/s12917-024-04277-4.BMC Vet Res. 2024.PMID:39304831Free PMC article.
- Global Prevalence and Hemagglutinin Evolution of H7N9 Avian Influenza Viruses from 2013 to 2022.Liu Q, Zeng H, Wu X, Yang X, Wang G.Liu Q, et al.Viruses. 2023 Nov 4;15(11):2214. doi: 10.3390/v15112214.Viruses. 2023.PMID:38005891Free PMC article.
- Genomic characterization and evolution of SARS-CoV-2 of a Canadian population.Zhang M, Li L, Luo M, Liang B.Zhang M, et al.PLoS One. 2021 Mar 4;16(3):e0247799. doi: 10.1371/journal.pone.0247799. eCollection 2021.PLoS One. 2021.PMID:33662015Free PMC article.
References
- Anisimova M, Kosiol C. Investigating protein-coding sequence evolution with probabilistic codon substitution models. Mol Biol Evol. 2009;26:255–271. - PubMed
- Bush RM, Fitch WM, Bender CA, Cox NJ. Positive selection on the H3 hemagglutinin gene of human influenza virus A. Mol Biol Evol. 1999;16:1457–1465. - PubMed
- Cadar D, Cságola A, Kiss T, Tuboly T. Capsid protein evolution and comparative phylogeny of novel porcine parvoviruses. Mol Phylogenet Evol. 2013;66:243–253. - PubMed
- Caton AJ, Brownlee GG, Yewdell JW, Gerhard W. The antigenic structure of the influenza virus A/PR/8/34 hemagglutinin (H1 subtype) Cell. 1982;31:417–427. - PubMed
- Corti D, Voss J, Gamblin SJ, et al. (23 co-authors) A neutralizing antibody selected from plasma cells that binds to group 1 and group 2 influenza A hemagglutinins. Science. 2011;333:850–856. - PubMed
Publication types
MeSH terms
Related information
Grants and funding
LinkOut - more resources
Full Text Sources
Other Literature Sources
