Movatterモバイル変換


[0]ホーム

URL:


Skip to main page content
U.S. flag

An official website of the United States government

Dot gov

The .gov means it’s official.
Federal government websites often end in .gov or .mil. Before sharing sensitive information, make sure you’re on a federal government site.

Https

The site is secure.
Thehttps:// ensures that you are connecting to the official website and that any information you provide is encrypted and transmitted securely.

NIH NLM Logo
Log inShow account info
Access keysNCBI HomepageMyNCBI HomepageMain ContentMain Navigation
pubmed logo
Advanced Clipboard
User Guide

Full text links

Free PMC article
Full text links

Actions

Share

Comparative Study
.2004 Nov-Dec;11(6):697-704.
doi: 10.1101/lm.73504.

Hippocampal sharp wave bursts coincide with neocortical "up-state" transitions

Affiliations
Comparative Study

Hippocampal sharp wave bursts coincide with neocortical "up-state" transitions

Francesco P Battaglia et al. Learn Mem.2004 Nov-Dec.

Abstract

The sleeping neocortex shows nested oscillatory activity in different frequency ranges, characterized by fluctuations between "up-states" and "down-states." High-density neuronal ensemble recordings in rats now reveal the interaction between synchronized activity in the hippocampus and neocortex: Electroencephalographic sharp waves in the hippocampus were more probable during down-states than during up-states, and tended to coincide with transitions from down-states to up-states. The form of cortical activity fluctuations and their interactions with sharp waves depend on sleep depth: In deeper sleep stages, characterized by strong neocortical oscillation in the delta range or slower (approximately 0.8-4 Hz), sharp-wave-triggered peri-event time histograms (PETH) are consistent with a longer duration for down-states than for up-states. In lighter sleep, the sharp-wave-triggered PETH suggested longer up-states than down-states. These results highlight the interplay in the hippocampal/neocortical loop: Decreased neocortical input during down-states may be a factor in generation of sharp waves. In turn, sharp waves may facilitate down-to-up transitions. This interplay may reflect joint memory trace reactivation in the hippocampus and in the neocortex, possibly contributing to consolidation of long-term memory: Off-line reactivation of recent neural activity patterns in the hippocampus occurs during 50-100-msec electroencephalographic sharp waves, corresponding to pyramidal-cell population bursts. The neocortical up-states starting in correspondence with sharp waves may be influenced by the reactivated information carried by the hippocampal sharp wave.


Figures

Figure 1
Figure 1
Recording location and yield of isolated units from a particularly successful recording session. Average yield per session was approximately 50 neurons. (A) Outline of the cortical structures spanned by the electrode array, as implanted on rats 1 and 2. The array on rat 3 was placed symmetrically over the midline. Electrode locations are represented by black dots. Colors indicate neocortical areas; (purple) visual; (green) somatosensory; (yellow) retrosplenial; (orange) motor and anterior cingulate. Calibration bar, 1 mm. (This figure was adapted from Zilles 1985 with permission from Springer © 1985.) (B) Graph of 96 simultaneously recorded neocortical single unit waveforms, plotted at locations of the corresponding recording electrodes. Calibration bar, 150 μV.
Figure 2
Figure 2
Example of simultaneous recording of hippocampal LFPs and 84 neocortical single units. This is a 10-sec excerpt from a rest period showing: LFP trace from the CA1 pyramidal layer, bandpass (100-300 Hz) filtered, with SPW/ripple complexes (top); the global average cortical firing rate (middle); and raster plot containing the spike trains from the simultaneously recorded cells (bottom). Cortical firing shows oscillations in the delta range (2-3 Hz) synchronized across all the sampled cortical areas. During the troughs of these oscillations, neuronal activity was often completely suppressed.
Figure 3
Figure 3
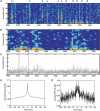
Global fluctuations of cortical activity and hippocampal sharp waves. (A) Power spectral density analysis of 700 sec of cortical activity. The power spectrum of combined instantaneous firing rate for the 84 recorded cells was estimated using a sliding 5-sec window. Episodes of coordinated oscillations in the spindle range (indicated by the s) and in the delta/slow range (indicated by the d) are visible. (B) Enlargement of the 100-sec period between the white dashed lines inA, showing delta oscillations. (C) Average instantaneous cortical firing rate during the same interval. The interval between the two red lines is the same as depicted in Figure 2. Note that the absolute values of the firing rates are different from Figure 2 because a larger smoothing parameter was used. (D) Autocorrelogram of the total activity of the recorded neocortical population. In each recording session, the spikes from all the recorded cells were pooled into a single binned time series that was used to compute the autocorrelation function. The normalization was chosen such that the asymptotic value of the autocorrelation coincides with the population average firing rate per cell. The data shown are an across-session average. The decline of the autocorrelogram was fit with an exponential function with a time constant of 2.4 ± 0.5 sec. Time bin, 200 msec. (E) Autocorrelogram of the time of occurrence of SPWs. There is a decay fromt = 0 to the baseline, that can be approximated with an exponential function with a time constant of 5.5 ± 0.06 sec. This indicates that SPWs do not occur as a Poisson process with a constant rate throughout the recording sessions.
Figure 4
Figure 4
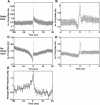
SPW interaction with neocortical neural activity. (A) Peri-event time histogram (PETH) of cortical population activity during the periods of identified global oscillations in the delta/slow range, centered on hippocampal sharp wave events. A transient increase in firing rate was evident at the time of the sharp waves. On the long time scale, the firing rate was larger after the sharp wave event. Firing rate showed a short lasting dip right before (200-400 msec) the SPW, probably related to the in-phase occurrence of delta oscillation, and was at baseline level shortly before that. After the SPW events, average cortical firing rate showed a much longer decay, spanning several seconds (error bars = SEM; bin size, 100 msec). (B) Same PETH, with an expanded scale, illustrating both the fast dip before SPWs and the transient increase at the time of SPWs (bin size, 20 msec). (C) Sharp-wave-triggered PETH (bin size, 100 msec) of cortical firing during periods in which oscillations in the delta/slow range were absent. The transient increase at SPW time was still present, albeit of smaller amplitude, but there was no fast dip preceding SPWs. A prolonged period of increasingly negative modulation was observed for several seconds leading up to the sharp waves. After SPWs, the return to baseline was relatively fast. (D) Same PETH shown on an enlarged scale (bin size, 20 msec). Note that, because the shapes of the PETH functions represent averages over many SPW events, they do not necessarily reflect the shape of individual events (see Fig. 6 for further explanation). (E) PETH of SPW event occurrence, centered on the down-to-up-state transitions in the total cortical spike activity, showing increased SPW probability around such transitions. Note that the baseline value was higher on theleft-hand side of the PETH than on theright-hand side, signaling that sharp waves were more frequent during the down-states than during the up-states.
Figure 5
Figure 5
Single unit activity modulation by SPWs. (A) Percentage of cells with firing rates that were significantly (p < 0.05) up-modulated (white bars) or down-modulated (black bars) in intervals centered on, or surrounding, the SPWs, as they were detected by the thresholding algorithm during the periods of identified global delta/slow cortical oscillations. The firing rates in 500-msec intervals spanning from 1500 to 1000 msec before the SPW (first pair of bars), from 700 to 200 msec before the SPW (second pair), the 500 msec after the SPW (fourth pair) and in the intervals between the beginnings and ends of SPWs (third pair), were compared with intervals of the same length starting 10 sec after each SPW. A large percentage of cells was up-modulated at the time of SPWs and 500 msec thereafter. At the time of the SPW, the number of down-modulated cells was actually significantly lower than the chance value of 2.5%. In the intervals before the SPW there were similar proportions of up-modulated and down-modulated cells. (B) Same comparison for the periods of time without global delta/slow oscillations. A large percentage of cells was down-modulated before the SPWs. A large proportion of cells was up-modulated at the time of the SPW, whereas similar proportions of cells were up- and down-modulated in the +500-msec interval. The dashed line here and inA represents the 2.5% chance level. A fraction of modulated cells close to that chance level would be attained if there were no statistical relationship between sharp waves and cortical firing, as in that case the intervals considered and the controls 10 sec later could be considered random time intervals with respect to the cortical firing (*: fraction of modulated cells different from chance level;p < 0.00001). (C) Schematic representation of the intervals used for the comparisons inA. The intervals used for the -1000 msec (500 msec), -200 msec (500 msec), SPW (beginning and ends detected by thresholding), and +500 msec (500 sec), and the corresponding control intervals are displayed.
Figure 6
Figure 6
Qualitative picture of the interaction between up-state and down-state transitions in cortical firing and hippocampal sharp waves and how the apparently gradual trends in the average PETH functions shown in Figure 4 can be accounted for by averaging over fluctuations in discrete states with variable durations. In these numerical simulations, the cortical state transitions occur randomly, according to a two-state Markov process, whose parameters represent the mean life of each state, and cortical firing rates are assumed to be constant within a given state. (A) In this situation, the mean life of the up-states is much shorter (3 sec) than the mean duration of the down-states (20 sec). If at least some proportion of the SPW occurs in correspondence with the down-to-up transition, the SPW-triggered PETH of cortical firing would look like the one inB, which resembles what is observed during the periods dominated by delta/slow oscillations, at least in terms of the long time scale behavior (long decline after the SPW, mostly flat before; see Fig. 4). (C) In the scenario in which the down-state is much shorter (3 sec) than the up-state (20 sec), the SPW-triggered, cortical PETH would look like the one inD, which is reminiscent of what is observed in the periods without delta/slow oscillations (long-lasting exponential trough leading to the SPWs, small modulation after the SPWs). The calibration bar inA andC represents 20 sec.
See this image and copyright information in PMC

Similar articles

See all similar articles

Cited by

See all "Cited by" articles

References

    1. Achermann, P. and Borbely, A.A. 1997. Low-frequency (<1 Hz) oscillations in the human sleep electroencephalogram. Neuroscience 81: 213-222. - PubMed
    1. Ball, G.J., Gloor, P., and Schaul, N. 1977. The cortical electromicrophysiology of pathological delta waves in the electroencephalogram of cats. Electroencephalogr. Clin. Neurophysiol. 43: 346-361. - PubMed
    1. Battaglia, F.P, Sutherland, G.R., and McNaughton, B.L. 2001. Widespread modulation of neocortical cell activity during hippocampal sharp waves. Soc. Neurosci. Abs. 27: 643.16.
    1. Buzsaki, G. 1989. Two-stage model of memory trace formation: A role for “noisy” brain states. Neuroscience 31: 551-570. - PubMed
    1. Buzsaki, G., Horvath, Z., Urioste, R., Hetke, J., and Wise, K. 1992. High-frequency network oscillation in the hippocampus. Science 256: 1025-1027. - PubMed

Publication types

MeSH terms

Grants and funding

LinkOut - more resources

Full text links
Free PMC article
Cite
Send To

NCBI Literature Resources

MeSHPMCBookshelfDisclaimer

The PubMed wordmark and PubMed logo are registered trademarks of the U.S. Department of Health and Human Services (HHS). Unauthorized use of these marks is strictly prohibited.


[8]ページ先頭

©2009-2025 Movatter.jp