 Jump to a detailed profile, search site with google or try
Spring, Texas

Spring: Champion Forest Drive & Cypresswood

Spring: Raveneaux Country Club off Cypresswood Dr

Spring: Benders Landing shopping center - Riley Fuzell and birnham woods

Spring: Rainbow - Spring, TX

Spring: Mercer Arboretum. Copyright (c) 2012 John Robles III and its licensors. All rights reserved.

Spring: Stuebner Airline Road and Louetta Intersection

Spring: Wendys in Spring, TX - On Spring Cypress - Across from my office

Spring: Old Town Spring - The Cafe

Spring: Louetta & Champion Forest Dr. - Looking North

Spring: Shopping Center Spring

Spring: Spring Cypress Rd - Eastbound

Spring: DownTown Spring
- add
your
Submit your own pictures of this place and show them to the world
- OSM Map
- General Map
- Google Map
- MSN Map
- OSM Map
- General Map
- Google Map
- MSN Map

- OSM Map
- General Map
- Google Map
- MSN Map
- OSM Map
- General Map
- Google Map
- MSN Map
Please wait while loading the map...
Population change since 2000: +85.7%
| Males: 34,100 | |
| Females: 33,462 |
| Median resident age: | 34.1 years |
| Texas median age: | 35.9 years |
Zip codes:77373.
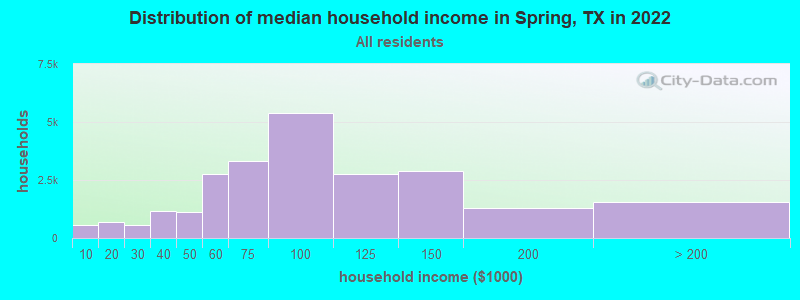
| Spring: | $84,489 |
| TX: | $75,780 |
Estimated per capita income in 2023: $32,271 (it was $21,027in 2000)
Spring CDP income, earnings, and wages data
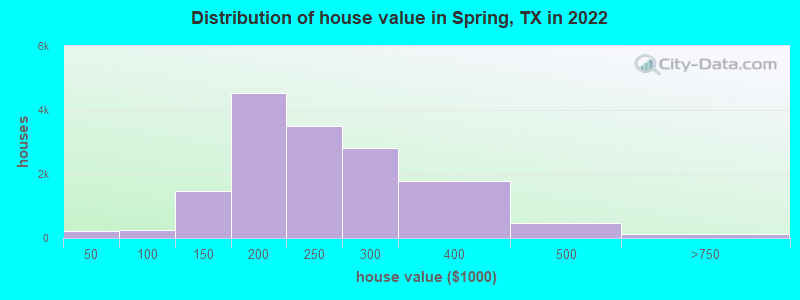
Estimated median house or condo value in 2023: $246,600 (it was $73,600in 2000)
| Spring: | $246,600 |
| TX: | $296,900 |
Mean prices in 2023:all housing units: $372,985;detached houses: $387,876;townhouses or other attached units: $317,495;in 2-unit structures: $187,819;in 3-to-4-unit structures: $177,356;in 5-or-more-unit structures: $326,402;mobile homes: $89,981;occupied boats, rvs, vans, etc.: $67,214
Median gross rent in 2023: $1,754.
(8.3%for White Non-Hispanic residents, 5.4%for Black residents, 9.3%for Hispanic or Latino residents, 17.0%for other race residents, 9.2%for two or more races residents)
Detailed information about poverty and poor residents in Spring, TX


Compare current foreclosures in Spring, TX:
| Photo | Address | Area | Beds / Baths | Price | Details |
|---|---|---|---|---|---|
 | #1 Wyanngate Drive Spring, TX 77373 | - sq. feet | 2 baths 4 beds | show details | |
 | #2 Beckets Crossing Ln Spring, TX 77373 | 1,899 sq. feet | 2 baths 3 beds | show details | |
 | #3 Northgate Springs Dr Spring, TX 77373 | 2,630 sq. feet | 3 baths 5 beds | show details | |
 | #4 Valley Palms Dr Spring, TX 77379 | 2,024 sq. feet | 2 baths 3 beds | show details | |
 | #5 Centre Place Cir Spring, TX 77379 | 7,800 sq. feet | 9 baths 5 beds | show details | |
 | #6 Berry Cresent Dr Spring, TX 77389 | 1,771 sq. feet | 2 baths 4 beds | show details | |
 | #7 Avalon Woods Dr Spring, TX 77373 | 1,525 sq. feet | 2 baths 3 beds | show details | |
 | #8 Aspen Tarn Trl Spring, TX 77373 | 1,398 sq. feet | 3 baths 3 beds | show details | |
 | #9 Juniper Meadows Dr Spring, TX 77388 | 2,760 sq. feet | 3 baths 4 beds | show details | |
 | #10 Brookgate Dr Spring, TX 77373 | 1,894 sq. feet | 2 baths 4 beds | show details |
| Photo | Address | Area | Beds / Baths | Price | Details |
|---|---|---|---|---|---|
 | #11 Pinecliff Grove Ct Spring, TX 77373 | 1,572 sq. feet | 2 baths 3 beds | show details | |
 | #12 Naples Dr Spring, TX 77373 | 1,421 sq. feet | 2 baths 3 beds | show details | |
 | #13 Stoney River Dr Spring, TX 77379 | 2,190 sq. feet | 2 baths 4 beds | show details | |
 | #14 Flaming Candle Dr Spring, TX 77388 | 2,931 sq. feet | 2 baths 4 beds | show details | |
 | #15 Snappy Creek Ln Spring, TX 77388 | 2,022 sq. feet | 2 baths 4 beds | show details | |
 | #16 Meadow Tree Ln Spring, TX 77388 | 2,592 sq. feet | 3 baths 4 beds | show details | |
 | #17 Cluster Ct Spring, TX 77379 | 1,823 sq. feet | 2 baths 3 beds | show details | |
 | #18 Mountain Crest Dr Spring, TX 77379 | 2,300 sq. feet | 2 baths 3 beds | show details | |
 | #19 W Canyon Wren Cir Spring, TX 77389 | 3,998 sq. feet | 4 baths 5 beds | show details | |
 | #20 Acorn Valley Dr Spring, TX 77389 | 1,712 sq. feet | 2 baths 4 beds | show details |
| Photo | Address | Area | Beds / Baths | Price | Details |
|---|---|---|---|---|---|
 | #21 Canyon Lake Dr Spring, TX 77373 | 1,764 sq. feet | 2 baths 3 beds | show details | |
 | #22 Township Elm St Spring, TX 77373 | 1,264 sq. feet | 2 baths 3 beds | show details | |
 | #23 Greenland Oak Ct Spring, TX 77373 | 2,281 sq. feet | 2 baths 4 beds | show details | |
 | #24 Pikecrest Dr Spring, TX 77389 | 3,406 sq. feet | 4 baths 4 beds | show details | |
 | #25 Llano River Loop Spring, TX 77386 | 1,410 sq. feet | 2 baths 4 beds | show details | |
 | #26 Rustington Dr Spring, TX 77379 | 2,434 sq. feet | 2 baths 4 beds | show details | |
 | #27 Shadow Valley Dr Spring, TX 77379 | 3,454 sq. feet | 3 baths 5 beds | show details | |
 | #28 Auburn Gardens Court Spring, TX 77373 | - sq. feet | 2 baths 3 beds | show details | |
 | #29 Thadds Trl Spring, TX 77373 | 1,419 sq. feet | 2 baths 3 beds | show details | |
 | #30 Stuebner Airline Rd Apt 104 Spring, TX 77379 | 1,103 sq. feet | 2 baths 2 beds | show details |
| Photo | Address | Area | Beds / Baths | Price | Details |
|---|---|---|---|---|---|
 | #31 Kobi Park Ct Spring, TX 77373 | 1,957 sq. feet | 2 baths 4 beds | show details | |
 | #32 Brat Pass Dr Spring, TX 77373 | 2,075 sq. feet | 2 baths 4 beds | show details | |
 | #33 Bridgestone Valley Dr Spring, TX 77388 | 1,975 sq. feet | 2 baths 4 beds | show details | |
 | #34 Forest Springs Lk Spring, TX 77373 | 2,188 sq. feet | 3 baths 4 beds | show details | |
 | #35 Driftstone Dr Spring, TX 77379 | 2,193 sq. feet | 3 baths 4 beds | show details | |
 | #36 Beacon Grove St Spring, TX 77389 | 2,056 sq. feet | 3 baths 4 beds | show details | |
 | #37 Perry Pass Ct Spring, TX 77379 | 5,233 sq. feet | 7 baths 5 beds | show details | |
 | #38 Boxford Ct Spring, TX 77373 | 2,240 sq. feet | 3 baths 3 beds | show details | |
 | #39 Treeloch Ln Spring, TX 77379 | 3,141 sq. feet | 4 baths 4 beds | show details | |
 | #40 River Mill Dr Spring, TX 77379 | 2,042 sq. feet | 2 baths 4 beds | show details |
| Photo | Address | Area | Beds / Baths | Price | Details |
|---|---|---|---|---|---|
 | #41 Briarstone Ridge Ln Spring, TX 77389 | 1,692 sq. feet | 2 baths 3 beds | show details | |
 | #42 Lake Voyageur Dr Spring, TX 77389 | 3,327 sq. feet | 2 baths 3 beds | show details | |
 | #43 Huckinston Ct Spring, TX 77379 | 2,580 sq. feet | 2 baths 3 beds | show details | |
 | #44 Firewood Ln Spring, TX 77373 | 1,361 sq. feet | 2 baths 3 beds | show details | |
 | #45 Stoney River Dr Spring, TX 77379 | 3,600 sq. feet | 3 baths 4 beds | show details | |
 | #46 Ashdown Forest Dr Spring, TX 77379 | 4,291 sq. feet | 3 baths 5 beds | show details | |
 | #47 Piney Heights Ln Spring, TX 77389 | 4,597 sq. feet | 3 baths 4 beds | show details | |
 | #48 Kingbriar Cir Spring, TX 77373 | 1,722 sq. feet | 2 baths 3 beds | show details | |
 | #49 Hickory Valley Ln Spring, TX 77373 | 2,434 sq. feet | 2 baths 4 beds | show details | |
 | Check over1 million property listings on Foreclosure.com! | browse all offers | |||


- 32,57248.2%Hispanic
- 15,24422.6%White alone
- 13,64220.2%Black alone
- 3,3565.0%Asian alone
- 1,4972.2%Other race alone
- 1,2511.9%Two or more races
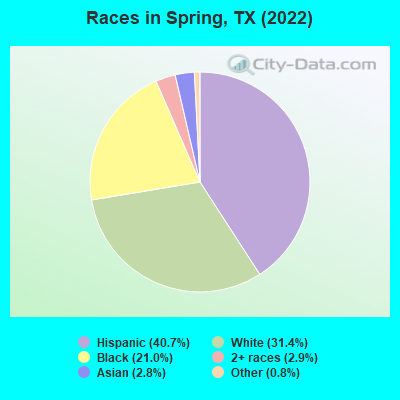
Races in Spring detailed stats: ancestries, foreign born residents, place of birth
According to our research of Texas and other state lists, therewere 359 registered sex offenders living in Spring, Texas as of April 02, 2025.
The ratio of all residents to sex offenders in Spring is 169 to 1.
 Recent articles from our blog. Our writers, many of them Ph.D. graduates or candidates, create easy-to-read articles on a wide variety of topics.

 | Dallas Suburbs/Exurbs Nature vs North Houston (Spring/Conroe/Woodlands) (18 replies) |
| West Houston Area (Spring Branch, Cinco Ranch) (26 replies) |
| Another Spring vs Katy Post (15 replies) |
| Odessa vs Big Spring Crime and Safety (1 reply) |
| Spring Valley Village vs 77024 (0 replies) |
| Spring Branch patio homes (13 replies) |
Latest news from Spring, TX collected exclusively by city-data.com from local newspapers, TV, and radio stations
Ancestries:American (3.8%),German (3.5%),Irish (2.7%),English (2.3%),European (2.2%),Nigerian (1.4%).
Current Local Time: CST time zone
Land area: 23.9square miles.
Population density: 2,823people per square mile (average).

12,168 residents are foreign born(13.5%Latin America, 2.0%Asia).
| This place: | 17.8% |
| Texas: | 17.2% |
Median real estate property taxes paid for housing units with mortgages in 2023: $3,991 (1.6%)
Median real estate property taxes paid for housing units with no mortgage in 2023: $4,152 (1.7%)
Nearest city with pop. 50,000+:Northwest Harris, TX (11.0 miles, pop. 405,444).
Nearest city with pop. 1,000,000+:Houston, TX (20.1 miles
, pop. 1,953,631).
Nearest cities:
Latitude: 30.05 N, Longitude: 95.39 W
Daytime population change due to commuting: -8,949 (-13.2%)
Workers who live and work in this place: 5,316 (16.6%)
Area codes: 281, 713, 832
Property values in Spring, TX
| Here: | 4.6% |
| Texas: | 4.2% |

- Health care & social assistance (15.0%)
- Retail trade (14.2%)
- Transportation & warehousing (12.4%)
- Construction (9.4%)
- Manufacturing (8.0%)
- Administrative & support & waste management services (6.0%)
- Educational services (6.0%)

- Transportation & warehousing (17.7%)
- Retail trade (13.4%)
- Construction (13.2%)
- Manufacturing (10.5%)
- Administrative & support & waste management services (7.8%)
- Professional, scientific, technical services (7.0%)
- Wholesale trade (5.8%)

- Health care & social assistance (29.6%)
- Retail trade (15.2%)
- Educational services (10.6%)
- Accommodation & food services (7.4%)
- Transportation & warehousing (5.8%)
- Public administration (5.1%)
- Finance & insurance (5.0%)
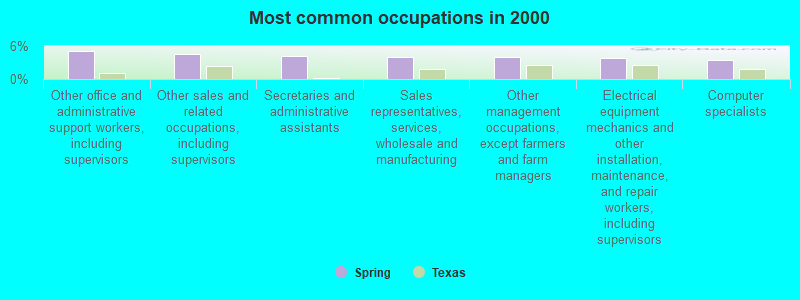
- Other office and administrative support workers, including supervisors (5.2%)
- Other sales and related occupations, including supervisors (4.5%)
- Secretaries and administrative assistants (4.1%)
- Sales representatives, services, wholesale and manufacturing (4.1%)
- Other management occupations, except farmers and farm managers (4.1%)
- Electrical equipment mechanics and other installation, maintenance, and repair workers, including supervisors (3.9%)
- Computer specialists (3.5%)
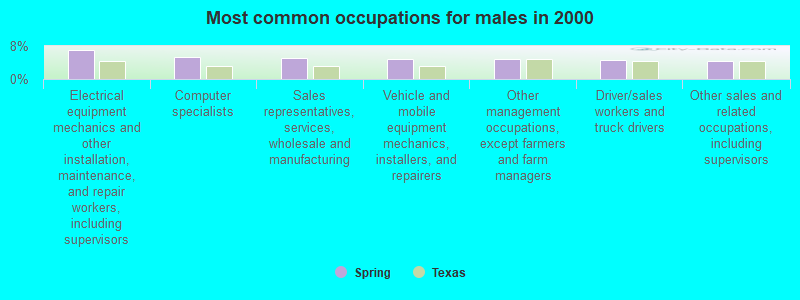
- Electrical equipment mechanics and other installation, maintenance, and repair workers, including supervisors (7.1%)
- Computer specialists (5.2%)
- Sales representatives, services, wholesale and manufacturing (5.0%)
- Vehicle and mobile equipment mechanics, installers, and repairers (4.9%)
- Other management occupations, except farmers and farm managers (4.8%)
- Driver/sales workers and truck drivers (4.6%)
- Other sales and related occupations, including supervisors (4.4%)
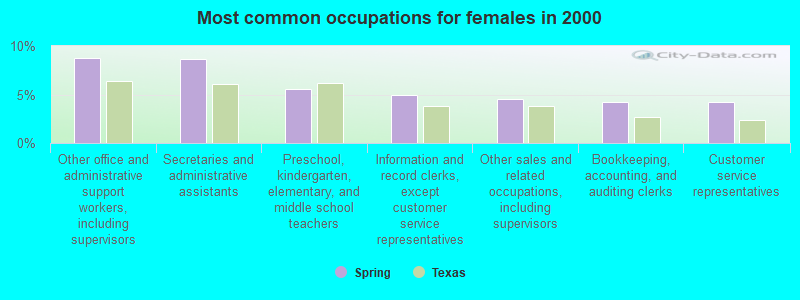
- Other office and administrative support workers, including supervisors (8.8%)
- Secretaries and administrative assistants (8.7%)
- Preschool, kindergarten, elementary, and middle school teachers (5.5%)
- Information and record clerks, except customer service representatives (5.0%)
- Other sales and related occupations, including supervisors (4.5%)
- Bookkeeping, accounting, and auditing clerks (4.2%)
- Customer service representatives (4.2%)
Average climate in Spring, Texas
Based on data reported by over 4,000 weather stations


|

(lower is better)
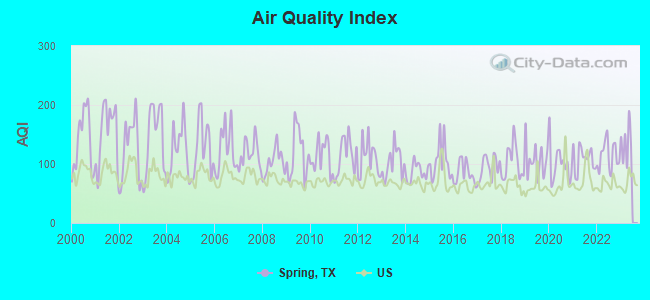
Air Quality Index (AQI) level in 2022 was114. This is significantly worse than average.
| City: | 114 |
| U.S.: | 73 |
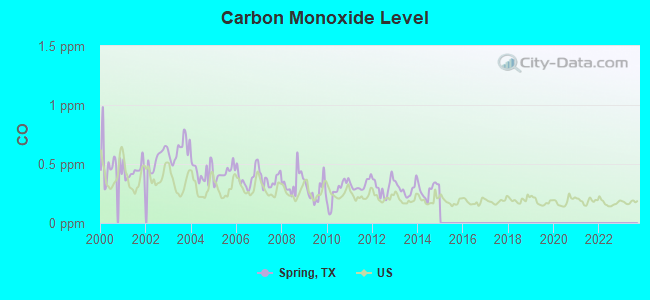
Carbon Monoxide (CO) [ppm] level in 2014 was0.282. This is about average.Closest monitor was 16.2 miles away from the city center.
| City: | 0.282 |
| U.S.: | 0.251 |
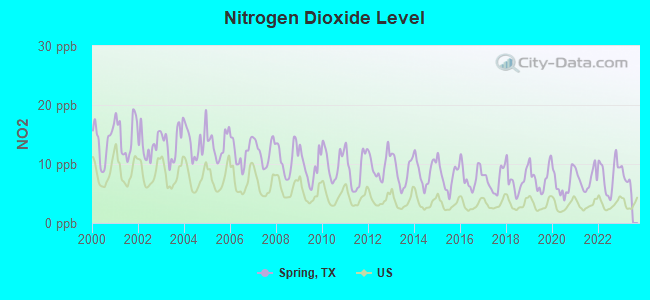
Nitrogen Dioxide (NO2) [ppb] level in 2022 was8.10. This is significantly worse than average.Closest monitor was 2.6 miles away from the city center.
| City: | 8.10 |
| U.S.: | 5.11 |
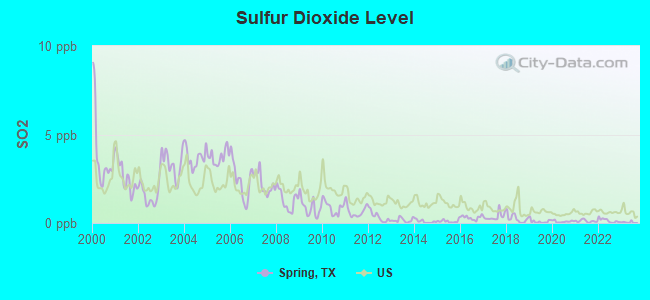
Sulfur Dioxide (SO2) [ppb] level in 2022 was0.136. This is significantly better than average.Closest monitor was 2.6 miles away from the city center.
| City: | 0.136 |
| U.S.: | 1.515 |
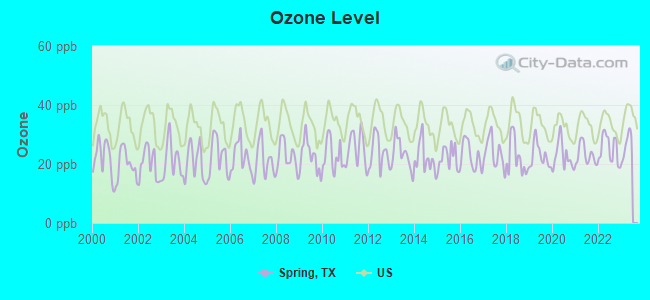
Ozone [ppb] level in 2022 was25.2. This is better than average.Closest monitor was 9.4 miles away from the city center.
| City: | 25.2 |
| U.S.: | 33.3 |
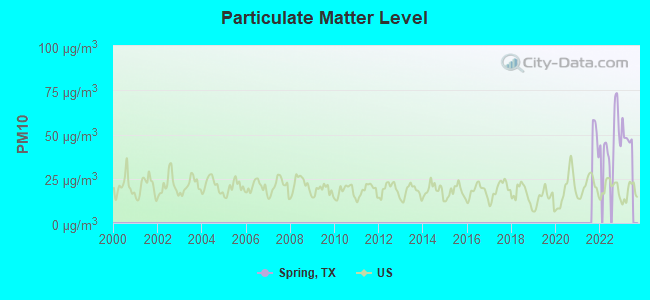
Particulate Matter (PM10) [µg/m3] level in 2022 was48.1. This is significantly worse than average.Closest monitor was 11.2 miles away from the city center.
| City: | 48.1 |
| U.S.: | 19.2 |
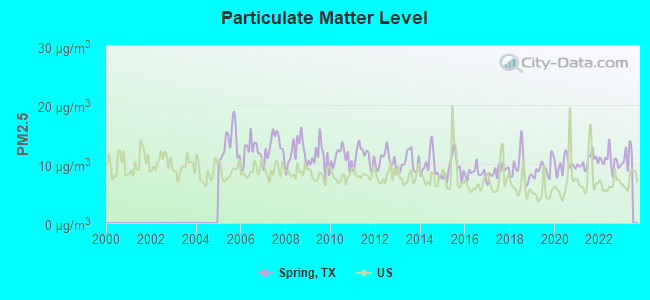
Particulate Matter (PM2.5) [µg/m3] level in 2022 was10.5. This is worse than average.Closest monitor was 11.2 miles away from the city center.
| City: | 10.5 |
| U.S.: | 8.1 |
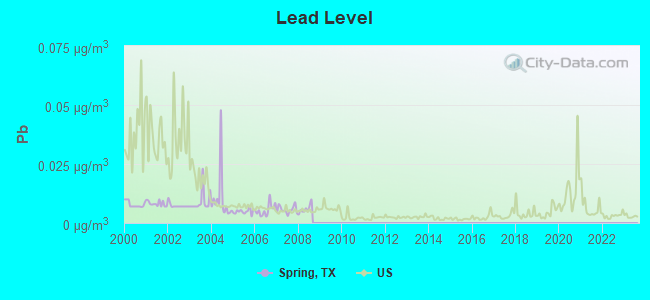
Lead (Pb) [µg/m3] level in 2008 was0.00590. This is significantly better than average.Closest monitor was 2.6 miles away from the city center.
| City: | 0.00590 |
| U.S.: | 0.00931 |
Tornado activity:
Spring-area historical tornado activity is slightly aboveTexas state average. It is 82%greater than the overall U.S. average.
On11/21/1992, acategoryF4 (max. wind speeds 207-260 mph)tornado23.3miles away from the Spring place centerinjured 16peopleand causedbetween $50,000,000and $500,000,000in damages.
On2/5/1986, acategoryF3 (max. wind speeds 158-206 mph)tornado7.6miles away from the place centerkilled 2peopleand causedbetween $5,000,000and $50,000,000in damages.
Earthquake activity:
Spring-area historical earthquake activity issignificantly above Texas state average. It is32% smallerthan the overall U.S. average.On5/17/2012at08:12:00, a magnitude 4.8 (4.8 MW, Depth:3.1 mi, Class: Light, Intensity: IV - V)earthquake occurred 142.8miles away from Spring center
On10/20/2011at12:24:41, a magnitude 4.8 (4.8 MW, Depth:3.1 mi)earthquake occurred 181.8miles away from the city center
On9/2/2013at23:51:15, a magnitude 4.3 (4.3 MW, Depth:2.9 mi)earthquake occurred 140.4miles away from the city center
On9/2/2013at21:52:38, a magnitude 4.2 (4.2 MW, Depth:3.0 mi)earthquake occurred 141.7miles away from Spring center
On1/25/2013at07:01:19, a magnitude 4.1 (4.1 MB, Depth:3.1 mi)earthquake occurred 139.6miles away from Spring center
On4/9/1993at12:29:19, a magnitude 4.3 (4.1 MB,4.3 LG, Depth:3.1 mi)earthquake occurred 185.9miles away from Spring center
Magnitude types: regional Lg-wave magnitude (LG), body-wave magnitude (MB), moment magnitude (MW)
Natural disasters:
The number of natural disasters in Harris County(39) isa lot greaterthan the US average (19).Major Disasters (Presidential) Declared: 22
Emergencies Declared: 6
Causes of natural disasters:Storms:17, Floods:16, Hurricanes:11, Tornadoes:8, Tropical Storms:5, Winds:3, Fires:2, Winter Storms:2, Other:2 (Note: some incidents may be assigned to more than one category).
Hospitals in Spring:
- COVENANT GRACE(1003 PINE WALK TRAIL)
- GREEN VALLEY HOUSE(5202 ALAMOSA LN)
- MEADOWHILL COMMUNITY HOME(21710 MEADOWHILL DR)
- PASSION HOUSE(19110 CANDLETRAIL DRIVE)
- SHENANDOAH HOUSE(28902 ENCHANTED DRIVE)
- SPRING GROUP HOME(17403 DEER CREEK)
- VERDECOVE COMMUNITY HOME(21023 VERDECOVE LANE)
Home Health Centers in Spring:
- ALTERNATIVE HEALTH CARE SVCS INC(16835 DEER CREEK DR SUITE 201)
- AMERIPRO HEALTHCARE GROUP LLC(16422 STUEBNER AIRLINE SUITE 218)
- AVATAR HOME HEALTH CARE AGENCY LLC(26003 OAK RIDGE DR)
- COLE HOME HEALTHCARE OF HOUSTON INC(16835 DEER CREEK DRIVE STE 200)
- EASTGATE HEALTHCARE SERVICES INC(16322 PERRY PASS COURT)
- PERPETUAL HOME HEALTH LLC(3423 CRYSTAL DOVE DRIVE)
- PROS HOME HEALTHCARE INC(210 SPRING HILL DRIVE SUITE 155)
- SILVER SPRING HOME HEALTHCARE SERVICES INC(7010 TEA OLIVE COURT)
Nursing Homes in Spring:
Heliports located in Spring:
See details about Heliports located in Spring,TXCollege/University in Spring:
Colleges/universities with over 2000 students nearest to Spring:
- Universal Technical Institute of Texas Inc. (about 5miles; Houston, TX;Full-time enrollment: 3,236)
- Lone Star College System (about 12miles; The Woodlands, TX;FT enrollment: 45,205)
- University of Houston-Downtown (about 21miles; Houston, TX;FT enrollment: 10,122)
- University of St Thomas (about 22miles; Houston, TX;FT enrollment: 2,747)
- Houston Community College (about 22miles; Houston, TX;FT enrollment: 38,303)
- The Art Institute of Houston (about 23miles; Houston, TX;FT enrollment: 2,429)
- Texas Southern University (about 23miles; Houston, TX;FT enrollment: 7,053)
Public high schools in Spring:
- KLEIN OAK H S(Students: 3,721,Location: 22603 NORTHCREST DR,Grades:9-12)
- SPRING H S(Students: 3,520,Location: 19428 INTERSTATE 45 N,Grades:9-12)
- KLEIN COLLINS H S(Students: 3,251,Location: 20811 ELLA BLVD,Grades:9-12)
- EVOLUTION ACADEMY HOUSTON(Location: 2414 SPRING CYPRESS RD,Grades:9-12,Charter school)
- CARL WUNSCHE SR H S(Location: 900 WUNSCHE LOOP,Grades:11-12)
Private high schools in Spring:
Biggest public elementary/middle schools in Spring:
- YORK J H(Students: 1,530,Location: 3515 WATERBEND COVE,Grades:7-8)
- SCHINDEWOLF INTERMEDIATE SCHOOL(Students: 1,494,Location: 20903 ELLA BLVD,Grades:6-8)
- SNYDER EL(Students: 1,220,Location: 28601 BIRNHAM WOODS DR,Grades:PK-4)
- HILDEBRANDT INT(Students: 1,217,Location: 22800 HILDEBRANDT RD,Grades:6-8)
- RICKEY C BAILEY MIDDLE(Students: 1,189,Location: 3377 JAMES C LEO DR,Grades:6-8)
- KAUFMAN EL(Students: 1,078,Location: 2760 NORTHRIDGE FOREST DR,Grades:PK-4)
- VOGEL INT(Students: 975,Location: 27125 GEFFERT WRIGHT LN,Grades:5-6)
- KREINHOP EL(Students: 932,Location: 21010 ELLA BLVD,Grades:PK-5)
- DUEITT MIDDLE(Students: 914,Location: 1 EAGLE CROSSING,Grades:6-8)
- METZLER EL(Students: 854,Location: 8500 W RAYFORD RD,Grades:PK-5)
Private elementary/middle schools in Spring:
- TRINITY LUTHERAN SCHOOL(Students: 724,Location: 18926 KLEIN CHURCH RD,Grades:PK-8)
- ST EDWARD CATHOLIC SCHOOL(Students: 289,Location: 2601 SPRING STUEBNER RD,Grades:PK-8)
- NORTHWOODS CATHOLIC SCHOOL(Students: 219,Location: 5500 FM 2920 RD,Grades:PK-8)
- SPELL WELL MONTESSORI SCHOOL(Students: 160,Location: 17512 W STRACK DR,Grades:PK-4)
- SPRING BAPTIST ACADEMY(Students: 110,Location: 1027 SPRING CYPRESS RD,Grades:PK-2)
User-submitted facts and corrections:
- Among churches for Spring, TX, you list Spring Memorial Baptist Church. It has been re-named. It's now Founders Baptist Church. The location is unchanged. See http://www.foundersbaptist.org
- Northwoods Catholic School, K-7th grade (8th grade 2004) 250 children, 5500 FM 2920, Spring Tx. 77388 281-350-0300
- Owners of School in the Pines. Number of students 88. Ages: 18 mths - 6 grade
- Solid Rock Christian Academy (private school K-4 to 12th) 130 Magic Oaks Spring, Texas 77388 281-907-0707 60 Students
Points of interest:
Spring Volunteer Fire Department Station 71, Spring Volunteer Fire Department Station 73, Spring Volunteer Fire Department Station 74, Wunsche Brothers Saloon and Hotel.Display/hide their locations on the map
Spring Center Shopping Center.Display/hide its location on the map
Candlestick Baptist Church, Cypress Trails United Methodist Church, Spring Antioch Baptist Church, Holy Comforter Episcopal Church, Lexington Woods Church of Christ, Tamina Church of Christ, Spring Creek Seventh Day Adventist Church, North Woods Baptist Church, Spring Memorial Baptist Church.Display/hide their locations on the map
Spring Cemetery, Wunsche Cemetery.Display/hide their locations on the map
Spring Stadium, Bayer Park.Display/hide their locations on the map
Civil War Museum (200 Noble Street Suite 6), Career Skills Corporation (Cultural Attractions- Events- & Facilities; 8139 Vintage Creek Dr), Aruba Tourism Authority (10655 Six Pines Road Suite 145).Display/hide their approximate locations on the map
Benchmark Hospitality (2170 Buckthorne Place Suite 400).Display/hide its approximate location on the map
Birthplace of: Chad Hedrick- Inline speed skater and ice speed skater, Eddie Steeples- Actor, Josh Beckett- 2005 Major League Baseball player (Florida Marlins,born: May 15, 1980), Megan Gibson- Softball player, Tony Franklin (American football)- Football player, Carl Bunch- Drummer, Corban Bates- College basketball player (Army Black Knights), Dextor Upshaw- College basketball player (Yale Bulldogs), Edjuan Green- College basketball player (Texas A&M Aggies), Helon Blount- Musical theatre actor.
Drinking water stations with addresses in Spring and their reported violations in the past:
SPLASHTOWN USA (Population served: 2,500, Groundwater):Past monitoring violations:BEAUMONT PLACE (Population served: 1,494, Groundwater):
- Monitoring and Reporting (DBP) -Between OCT-2008and DEC-2008, Contaminant: Chlorine. Follow-up actions: St Public Notif requested (MAR-27-2009), St Violation/Reminder Notice (MAR-27-2009), St Other (JUL-01-2009), St Compliance achieved (JUL-17-2014)
Past health violations:CASTLEWOOD SUBDIVISION (Population served: 1,011, Groundwater):Past monitoring violations:
- MCL, Acute (TCR) -In OCT-2008, Contaminant: Coliform. Follow-up actions: St Compliance achieved (OCT-31-2008), St Public Notif requested (DEC-02-2008), St Violation/Reminder Notice (DEC-02-2008), St Boil Water Order (DEC-02-2008)
- Monitoring, Source Water (GWR) -In OCT-01-2011, Contaminant: E. COLI. Follow-up actions: St Public Notif requested (DEC-09-2011), St Violation/Reminder Notice (DEC-09-2011), St Public Notif received (APR-05-2012)
- 2regular monitoring violations
Past health violations:BAYER WATER SYSTEM (Population served: 936, Groundwater):Past monitoring violations:
- MCL, Monthly (TCR) -In AUG-2010, Contaminant: Coliform. Follow-up actions: St Compliance achieved (AUG-31-2010), St Public Notif requested (SEP-23-2010), St Violation/Reminder Notice (SEP-23-2010)
- Monitoring and Reporting (DBP) -Between JAN-2011and DEC-2013, Contaminant: TTHM. Follow-up actions: St Public Notif requested (JUL-23-2014), St Violation/Reminder Notice (JUL-23-2014), St Compliance achieved (AUG-22-2014)
- Monitoring and Reporting (DBP) -Between JAN-2011and DEC-2013, Contaminant: Total Haloacetic Acids (HAA5). Follow-up actions: St Public Notif requested (JUL-23-2014), St Violation/Reminder Notice (JUL-23-2014), St Compliance achieved (AUG-22-2014)
- Monitoring, Repeat Major (TCR) -In AUG-2010, Contaminant: Coliform (TCR). Follow-up actions: St Compliance achieved (AUG-31-2010), St Public Notif requested (SEP-24-2010), St Violation/Reminder Notice (SEP-24-2010)
- Oneregular monitoring violation
Past monitoring violations:HARRIS COUNTY PCT 4 KLEIN PARK (Population served: 500, Groundwater):
- Monitoring and Reporting (DBP) -Between JUL-2010and SEP-2010, Contaminant: Chlorine. Follow-up actions: St Compliance achieved (JUL-17-2014)
- Oneminor monitoring violation
Past monitoring violations:COURTESY MART 2 (Population served: 402, Groundwater):
- Oneroutine major monitoring violation
Past monitoring violations:MY DREAM BALLROOM (Population served: 300, Groundwater):
- Oneregular monitoring violation
Past health violations:CYPRESSWOOD GOLF CLUB (Population served: 300, Groundwater):Past monitoring violations:
- MCL, Monthly (TCR) -In MAR-2005, Contaminant: Coliform. Follow-up actions: St Compliance achieved (MAR-31-2005), St Public Notif requested (APR-02-2005), St Violation/Reminder Notice (APR-02-2005)
- Oneminor monitoring violation
- 2regular monitoring violations
Past monitoring violations:
- 4routine major monitoring violations
Drinking water stations with addresses in Spring that have no violations reported:
- FASTRAC STORE 280 (Population served: 250,Primary Water Source Type: Groundwater)
- HARRIS COUNTY PCT 4 BURROUGHS PARK (Population served: 250,Primary Water Source Type: Groundwater)
- GAS N STUFF (Population served: 200,Primary Water Source Type: Groundwater)
- SPRING KLEIN SPORTS ASSOCIATION (Population served: 200,Primary Water Source Type: Groundwater)
- HARRIS COUNTY PCT 4 SPRING CREEK (Population served: 200,Primary Water Source Type: Groundwater)
- MOMS COUNTRY KITCHEN (Population served: 180,Primary Water Source Type: Groundwater)
- QUICK TIME (Population served: 150,Primary Water Source Type: Groundwater)
- ALLENDALE WATER SYSTEM (Population served: 138,Primary Water Source Type: Groundwater)
- TIMBER RIDGE RV VILLAGE (Population served: 126,Primary Water Source Type: Groundwater)
- LOUETTA ROAD BAPTIST CHURCH (Population served: 100,Primary Water Source Type: Groundwater)
| This place: | 3.0 people |
| Texas: | 2.8 people |
| This place: | 77.9% |
| Whole state: | 69.9% |
| This place: | 6.7% |
| Whole state: | 6.0% |
Likely homosexual households (counted as self-reported same-sex unmarried-partner households)
- Lesbian couples: 0.5%of all households
- Gay men: 0.3%of all households
3people in other noninstitutional group quarters in 2000
2people in other nonhousehold living situations in 2000
Banks with most branches in Spring (2011 data):
- Wells Fargo Bank, National Association: 9 branches. Info updated 2011/04/05:Bank assets: $1,161,490.0 mil, Deposits: $905,653.0 mil, headquarters in Sioux Falls, SD, positive income,6395total offices, Holding Company: Wells Fargo & Company
- JPMorgan Chase Bank, National Association: 9 branches. Info updated 2011/11/10:Bank assets: $1,811,678.0 mil, Deposits: $1,190,738.0 mil, headquarters in Columbus, OH, positive income, International Specialization,5577total offices, Holding Company: Jpmorgan Chase & Co.
- Woodforest National Bank: 8 branches. Info updated 2011/05/10:Bank assets: $3,488.9 mil, Deposits: $3,097.6 mil, headquarters in Houston, TX, positive income, Commercial Lending Specialization,766total offices, Holding Company: Woodforest Financial Group Employee Stock Ownership Plan (With 401(K) Provisions)
- Bank of America, National Association: Kleinwood Branch, Kuykendahl Banking Store Branch, Luetta Branch, Champion Forest Branch, Cypressdale Branch, Woodwinds Branch. Info updated 2009/11/18:Bank assets: $1,451,969.3 mil, Deposits: $1,077,176.8 mil, headquarters in Charlotte, NC, positive income,5782total offices, Holding Company: Bank Of America Corporation
- Capital One, National Association: East Spring Branch, Kuykendahl Branch, Research Forest Branch, Champions Branch, Glennloch Branch. Info updated 2011/07/01:Bank assets: $133,477.8 mil, Deposits: $97,063.7 mil, headquarters in Mclean, VA, positive income,984total offices, Holding Company: Capital One Financial Corporation
- Compass Bank: Kuykendahl Branch, Spring Branch, Sterling Ridge Branch, Rayford Road Branch, Champion Branch. Info updated 2011/02/24:Bank assets: $63,107.0 mil, Deposits: $46,232.4 mil, headquarters in Birmingham, AL, negative income in the last year, Commercial Lending Specialization,720total offices, Holding Company: Banco Bilbao Vizcaya Argentaria, S.A.
- Amegy Bank National Association: Cypresswood Branch, Spring, Champions Branch, Stuebner Airline Branch, Old Town Spring Branch. Info updated 2007/09/24:Bank assets: $12,197.6 mil, Deposits: $9,733.2 mil, headquarters in Houston, TX, positive income, Commercial Lending Specialization,97total offices, Holding Company: Zions Bancorporation
- First National Bank Texas: Spring Cypress Banking Center - Rc 4at 1461 Spring Cypress, branch established on 2004/01/19; Treaschwig Banking Center - Rc 358at 5671 Treaschwig, branch established on 2004/01/19. Info updated 2006/11/03:Bank assets: $944.3 mil, Deposits: $815.9 mil, headquarters in Killeen, TX, positive income, Mortgage Lending Specialization,250total offices, Holding Company: First Community Bancshares, Inc.
- The Chasewood Bank: Cypresswood Branchat 8500 Cypresswood, branch established on 2000/06/26. Info updated 2006/11/03:Bank assets: $115.9 mil, Deposits: $105.6 mil, headquarters in Houston, TX, positive income, Commercial Lending Specialization,2total offices
- 6other banks with 6local branches
For population 15 years and over in Spring:
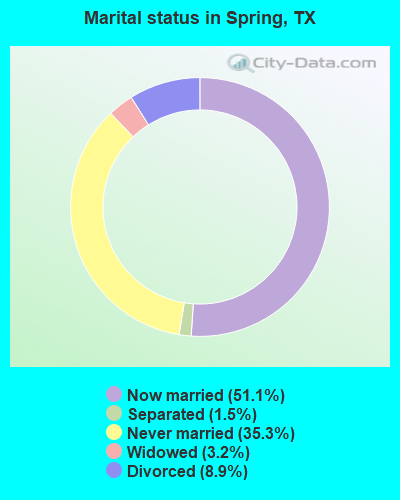
- Never married: 32.3%
- Now married: 54.1%
- Separated: 2.2%
- Widowed: 3.6%
- Divorced: 7.7%
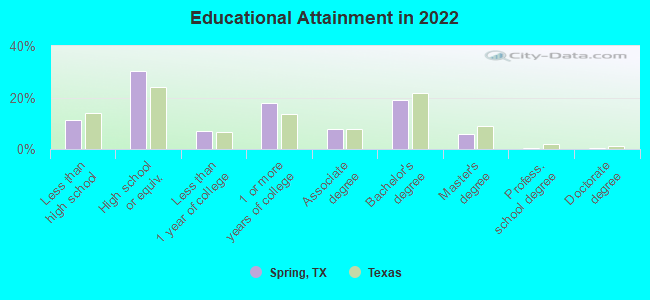
For population 25 years and over in Spring:
- High school or higher: 86.1%
- Bachelor's degree or higher: 23.6%
- Graduate or professional degree: 5.3%
- Unemployed: 3.7%
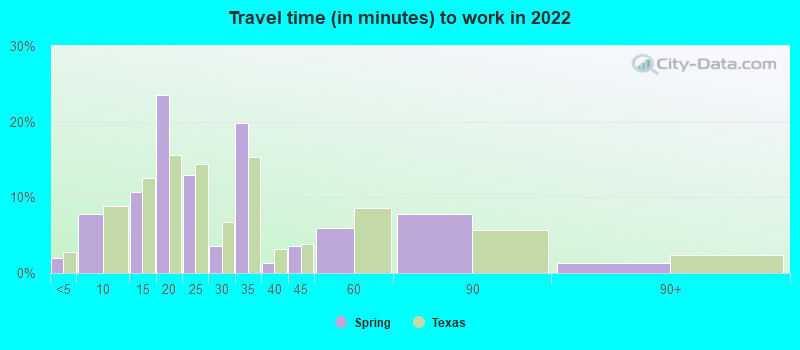
- Mean travel time to work (commute): 28.7 minutes
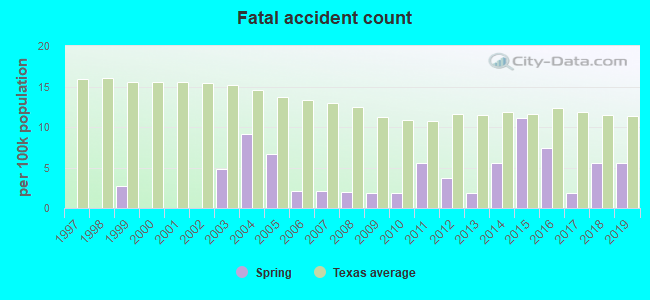
| Here: | 12.8 |
| Texas average: | 14.0 |
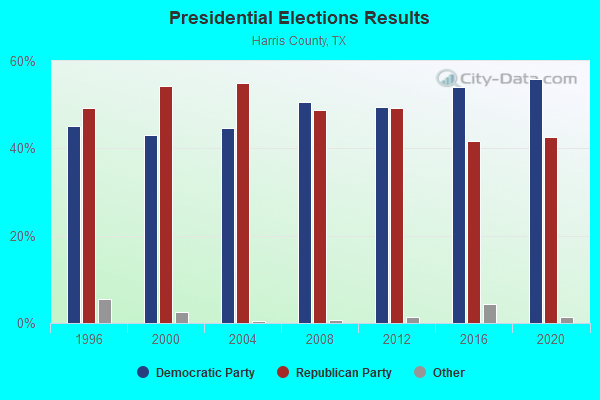
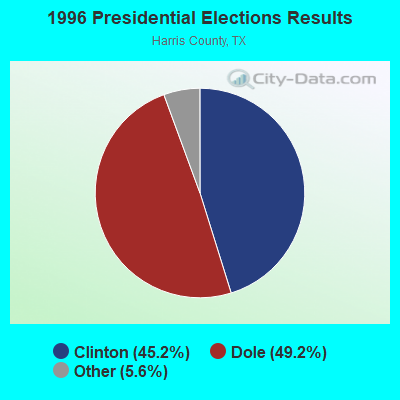
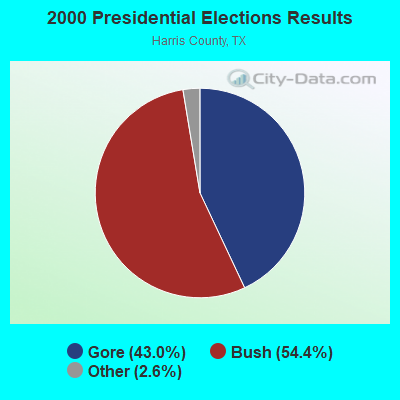
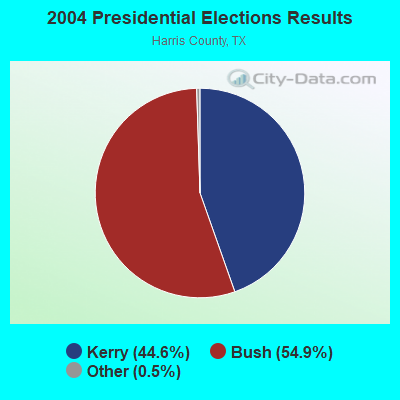
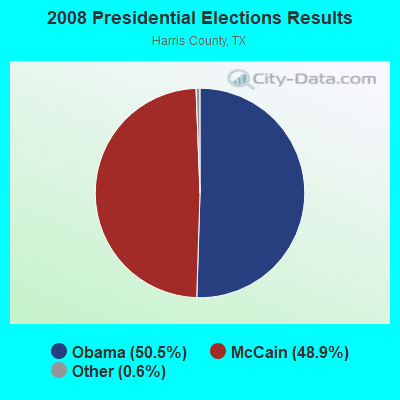
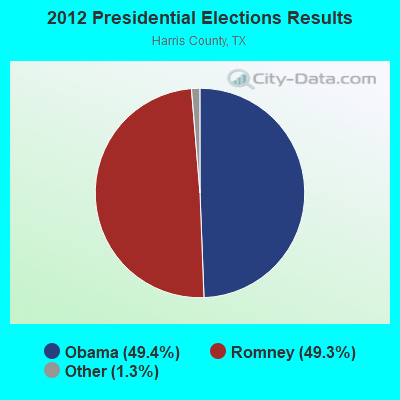
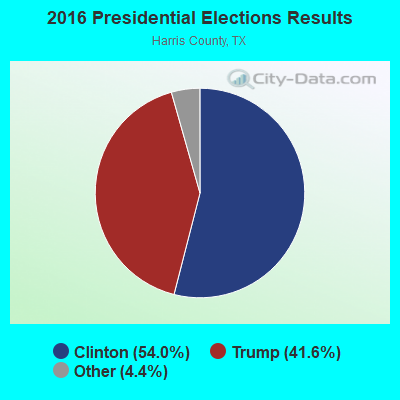
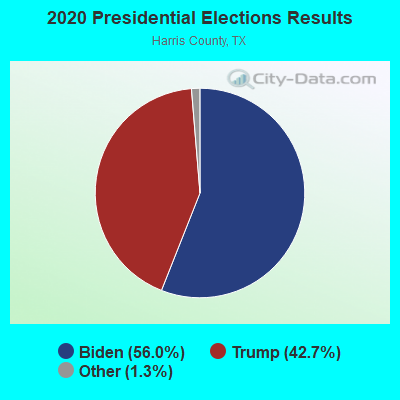

Graphs represent county-level data.Detailed 2008 Election Results
Religion statistics for Spring, TX (based on Harris County data)
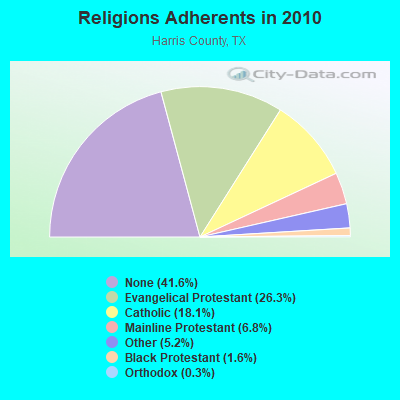
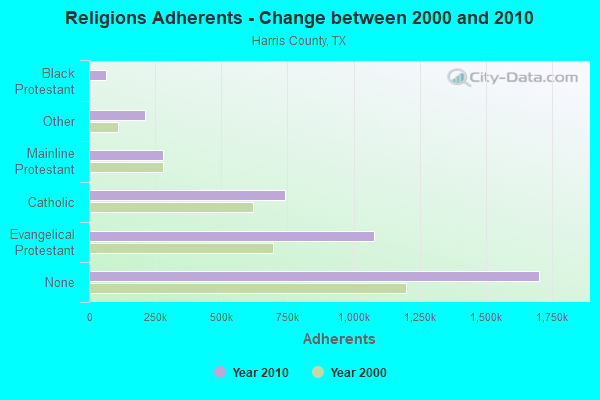
| Religion | Adherents | Congregations |
|---|---|---|
| Evangelical Protestant | 1,077,287 | 2,102 |
| Catholic | 741,896 | 109 |
| Mainline Protestant | 278,855 | 288 |
| Other | 213,212 | 296 |
| Black Protestant | 65,641 | 211 |
| Orthodox | 12,884 | 25 |
| None | 1,702,684 | - |
Food Environment Statistics:
| This county: | 1.88 / 10,000 pop. |
| Texas: | 1.47 / 10,000 pop. |
| This county: | 0.10 / 10,000 pop. |
| Texas: | 0.14 / 10,000 pop. |
| This county: | 1.35 / 10,000 pop. |
| Texas: | 1.11 / 10,000 pop. |
| Harris County: | 3.38 / 10,000 pop. |
| Texas: | 3.95 / 10,000 pop. |
| Harris County: | 5.88 / 10,000 pop. |
| Texas: | 6.13 / 10,000 pop. |
| This county: | 8.9% |
| Texas: | 8.9% |
| Here: | 26.0% |
| Texas: | 26.6% |
| Harris County: | 17.1% |
| State: | 15.7% |
Health and Nutrition:
| This city: | 48.7% |
| Texas: | 48.6% |
| Spring: | 47.4% |
| Texas: | 47.4% |
| Here: | 28.8 |
| Texas: | 28.5 |
| Here: | 21.5% |
| Texas: | 20.6% |
| This city: | 9.9% |
| Texas: | 10.3% |
| This city: | 6.8 |
| Texas: | 6.8 |
| This city: | 34.2% |
| Texas: | 33.1% |
| Spring: | 57.4% |
| Texas: | 56.2% |
| Spring: | 81.2% |
| State: | 80.7% |
More about Health and Nutrition of Spring, TX Residents
5.26%of this county's 2021 resident taxpayers lived in other counties in 2020 ($67,872average adjusted gross income)
| Here: | 5.26% |
| Texas average: | 8.12% |
0.02%of residents moved from foreign countries ($158average AGI)
Harris County: 0.02% Texas average: 0.04%
Top counties from which taxpayers relocated into this county between 2020 and 2021:
| fromFort Bend County, TX | |
| fromMontgomery County, TX | |
| fromGalveston County, TX |
5.91%of this county's 2020 resident taxpayers moved to other counties in 2021 ($76,622average adjusted gross income)
| Here: | 5.91% |
| Texas average: | 7.40% |
0.01%of residents moved to foreign countries ($155average AGI)
Harris County: 0.01% Texas average: 0.03%
Top counties to which taxpayers relocated from this county between 2020 and 2021:
| toFort Bend County, TX | |
| toMontgomery County, TX | |
| toBrazoria County, TX |
| Businesses in Spring, TX | ||||
| Name | Count | Name | Count | |
|---|---|---|---|---|
| 24 Hour Fitness | 1 | Lane Bryant | 1 | |
| 99 Cents Only Stores | 1 | Little Caesars Pizza | 3 | |
| AT&T | 5 | Long John Silver's | 3 | |
| Academy Sports + Outdoors | 1 | Lowe's | 2 | |
| Ace Hardware | 3 | MasterBrand Cabinets | 10 | |
| Advance Auto Parts | 4 | McDonald's | 10 | |
| Arby's | 1 | Motel 6 | 1 | |
| AutoZone | 5 | New Balance | 2 | |
| Baskin-Robbins | 1 | Nike | 3 | |
| Bath & Body Works | 1 | Office Depot | 1 | |
| Blockbuster | 5 | Olive Garden | 1 | |
| Burger King | 3 | Panda Express | 1 | |
| CVS | 9 | Papa John's Pizza | 2 | |
| Catherines | 1 | Payless | 2 | |
| Chick-Fil-A | 2 | Penske | 3 | |
| Church's Chicken | 3 | Pizza Hut | 4 | |
| Cricket Wireless | 11 | Popeyes | 3 | |
| Curves | 3 | Quiznos | 4 | |
| DHL | 8 | RadioShack | 3 | |
| Dairy Queen | 1 | SAS Shoes | 1 | |
| Decora Cabinetry | 5 | SONIC Drive-In | 6 | |
| Dennys | 3 | Safeway | 2 | |
| Discount Tire | 3 | Sears | 1 | |
| Domino's Pizza | 5 | Sprint Nextel | 5 | |
| Express | 1 | Starbucks | 14 | |
| Extended Stay America | 1 | Subway | 1 | |
| Famous Footwear | 1 | Super 8 | 1 | |
| FedEx | 30 | T-Mobile | 9 | |
| Firestone Complete Auto Care | 4 | Taco Bell | 6 | |
| Forever 21 | 1 | Target | 1 | |
| GNC | 2 | The Room Place | 1 | |
| GameStop | 2 | Toyota | 1 | |
| H&R Block | 4 | True Value | 2 | |
| Hobby Lobby | 1 | U-Haul | 10 | |
| Home Depot | 1 | UPS | 31 | |
| IHOP | 1 | Urban Outfitters | 1 | |
| Jack In The Box | 7 | Vans | 1 | |
| Jimmy John's | 1 | Verizon Wireless | 4 | |
| Jones New York | 1 | Vons | 2 | |
| KFC | 3 | Walgreens | 7 | |
| Kohl's | 1 | Walmart | 4 | |
| Kroger | 9 | Wendy's | 5 | |
| LA Fitness | 2 | |||
Strongest AM radio stations in Spring:
- KGOL (1180 AM; 50 kW; HUMBLE, TX;Owner: ENTRAVISION HOLDINGS, LLC)
- KKHT (1070 AM; 10 kW; HOUSTON, TX;Owner: SOUTH TEXAS BROADCASTING, INC.)
- KTRH (740 AM; 50 kW; HOUSTON, TX;Owner: AMFM TEXAS LICENSES LIMITED PARTNERSHIP)
- KSEV (700 AM; 15 kW; TOMBALL, TX;Owner: LIBERMAN BROADCASTING OF HOUSTON LICENSE CORP.)
- KILT (610 AM; 5 kW; HOUSTON, TX;Owner: TEXAS INFINITY BROADCASTING L.P.)
- KLAT (1010 AM; 10 kW; HOUSTON, TX;Owner: TICHENOR LICENSE CORPORATION ("TLC"))
- KBME (790 AM; 5 kW; HOUSTON, TX;Owner: AMFM TEXAS LICENSES LTD. PARTNERSHIP)
- KJOJ (880 AM; 10 kW; CONROE, TX;Owner: LIBERMAN BROADCASTING OF HOUSTON LICENSE CORP.)
- KPRC (950 AM; 5 kW; HOUSTON, TX;Owner: CCB TEXAS LICENSES, L.P.)
- KMIC (1590 AM; 5 kW; HOUSTON, TX;Owner: ABC, INC)
- KILE (1560 AM; 50 kW; BELLAIRE, TX;Owner: THE RAFTT CORPORATION)
- KEYH (850 AM; 10 kW; HOUSTON, TX;Owner: LIBERMAN BROADCASTING OF HOUSTON LICENSE CORP.)
- KYOK (1140 AM; daytime; 5 kW; CONROE, TX;Owner: MARTIN BROADCASTING, INC.)
Strongest FM radio stations in Spring:
- KTRU (91.7 FM; HOUSTON, TX;Owner: WILLIAM MARSH RICE UNIVERSITY)
- KHPT (106.9 FM; CONROE, TX;Owner: CXR HOLDINGS, INC.)
- KMJQ (102.1 FM; HOUSTON, TX;Owner: RADIO ONE LICENSES, LLC)
- KPFT (90.1 FM; HOUSTON, TX;Owner: PACIFICA FOUNDATION, INC.)
- KVST (103.7 FM; WILLIS, TX;Owner: NEW WAVO COMMUNICATION GROUP, INC.)
- KBXX (97.9 FM; HOUSTON, TX;Owner: RADIO ONE LICENSES, LLC)
- KHJZ-FM (95.7 FM; HOUSTON, TX;Owner: TEXAS INFINITY BROADCASTING L.P.)
- KHMX (96.5 FM; HOUSTON, TX;Owner: CITICASTERS LICENSES, L.P.)
- KILT-FM (100.3 FM; HOUSTON, TX;Owner: TEXAS INFINITY BROADCASTING L.P.)
- KKBQ-FM (92.9 FM; PASADENA, TX;Owner: CXR HOLDINGS, INC.)
- KLOL (101.1 FM; HOUSTON, TX;Owner: AMFM TEXAS LICENSES LIMITED PARTNERSHIP)
- KODA (99.1 FM; HOUSTON, TX;Owner: AMFM TEXAS LICENSES LIMITED PARTNERSHIP)
- KTBZ-FM (94.5 FM; HOUSTON, TX;Owner: AMFM TEXAS LICENSES LIMITED PARTNERSHIP)
- KLTN (102.9 FM; HOUSTON, TX;Owner: HBC HOUSTON LICENSE CORPORATION)
- KRBE (104.1 FM; HOUSTON, TX;Owner: KRBE LICO, INC.)
- KUHF (88.7 FM; HOUSTON, TX;Owner: UNIVERSITY OF HOUSTON SYSTEM)
- KKRW (93.7 FM; HOUSTON, TX;Owner: CAPSTAR TX LIMITED PARTNERSHIP)
- KSBJ (89.3 FM; HUMBLE, TX;Owner: KSBJ EDUCATIONAL FOUNDATION)
- KHCB-FM (105.7 FM; HOUSTON, TX;Owner: HOUSTON CHRISTIAN BROADCASTERS, INC.)
- KTHT (97.1 FM; CLEVELAND, TX;Owner: CXR HOLDINGS, INC.)
TV broadcast stations around Spring:
- K30CV (Channel 30; HOUSTON, TX;Owner: BROADCASTING SYSTEMS, INC.)
- KPRC-TV (Channel 2; HOUSTON, TX;Owner: POST-NEWSWEEK STATIONS, HOUSTON, LP)
- KHOU-TV (Channel 11; HOUSTON, TX;Owner: KHOU-TV, L.P.)
- KVVV-LP (Channel 53; HOUSTON, TX;Owner: KAZH LICENSE, LLC)
- KRIV (Channel 26; HOUSTON, TX;Owner: FOX TELEVISION STATIONS, INC.)
- KPXB (Channel 49; CONROE, TX;Owner: PAXSON HOUSTON LICENSE, INC.)
- KFTH (Channel 67; ALVIN, TX;Owner: TELEFUTURA HOUSTON LLC)
- KTRK-TV (Channel 13; HOUSTON, TX;Owner: KTRK TELEVISION, INC.)
- KHWB (Channel 39; HOUSTON, TX;Owner: KHWB, INC.)
- KNWS-TV (Channel 51; KATY, TX;Owner: JOHNSON BROADCASTING, INC.)
- KTBU (Channel 55; CONROE, TX;Owner: HUMANITY INTERESTED MEDIA, INC.)
- KTXH (Channel 20; HOUSTON, TX;Owner: FOX TELEVISION STATIONS, INC.)
- KUHT (Channel 8; HOUSTON, TX;Owner: UNIVERSITY OF HOUSTON SYSTEM)
- KXLN-TV (Channel 45; ROSENBERG, TX;Owner: KXLN LICENSE PARTNERSHIP, L.P.)
- KZJL (Channel 61; HOUSTON, TX;Owner: KZJL LICENSE CORP.)
- KETH (Channel 14; HOUSTON, TX;Owner: COMMUNITY EDUCATIONAL TV, INC.)
- KVQT-LP (Channel 24; HOUSTON, TX;Owner: C. DOWEN JOHNSON)
- KJIB-LP (Channel 5; CLEAR LAKE CITY, TX;Owner: FAR EASTERN TELECASTERS)
- KVDO-LP (Channel 69; CLEAR LAKE, TX;Owner: FAR EASTERN TELECASTERS)
- KBPX-LP (Channel 33; HOUSTON, TX;Owner: PAXSON COMMUNICATIONS LPTV, INC.)
- KTMD (Channel 48; GALVESTON, TX;Owner: TELEMUNDO OF TEXAS PARTNERSHIP, LP)
- KHMV-LP (Channel 28; HOUSTON, TX;Owner: PAPPAS TELECASTING OF THE GULF COAST, A CALIFORNIA LP)
- KBTX-TV (Channel 3; BRYAN, TX;Owner: KWTX-KBTX LICENSEE CORP.)
- KLTJ (Channel 22; GALVESTON, TX;Owner: WORD OF GOD FELLOWSHIP, INC.)
- KVIT-LP (Channel 28; VICTORIA, TX;Owner: CLUB COMMUNICATIONS)
- National Bridge Inventory (NBI) Statistics
- 64Number of bridges
- 2,684ft / 818mTotal length
- $596,000Total costs
- 386,696Total average daily traffic
- 13,863Total average daily truck traffic
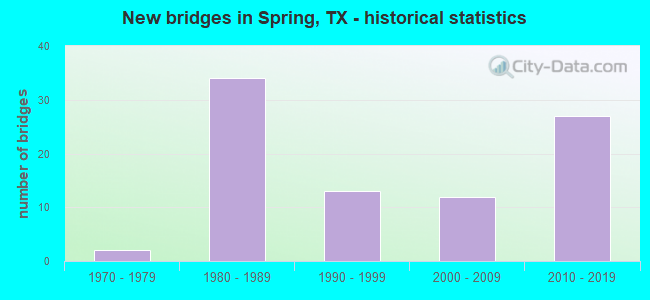
- New bridges - historical statistics
- 21970-1979
- 321980-1989
- 71990-1999
- 42000-2009
- 192010-2019
FCC Registered Commercial Land Mobile Towers:1 (See the full list of FCC Registered Commercial Land Mobile Towers in Spring, TX)
FCC Registered Broadcast Land Mobile Towers:50 (See the full list of FCC Registered Broadcast Land Mobile Towers)
FCC Registered Microwave Towers:372 (See the full list of FCC Registered Microwave Towers in this town)
FCC Registered Paging Towers:1 (See the full list of FCC Registered Paging Towers)
FCC Registered Maritime Coast & Aviation Ground Towers:9 (See the full list of FCC Registered Maritime Coast & Aviation Ground Towers)
FCC Registered Amateur Radio Licenses:1,308 (See the full list of FCC Registered Amateur Radio Licenses in Spring)
FAA Registered Aircraft Manufacturers and Dealers:12 (See the full list of FAA Registered Manufacturers and Dealers in Spring)
FAA Registered Aircraft:329 (See the full list of FAA Registered Aircraft)
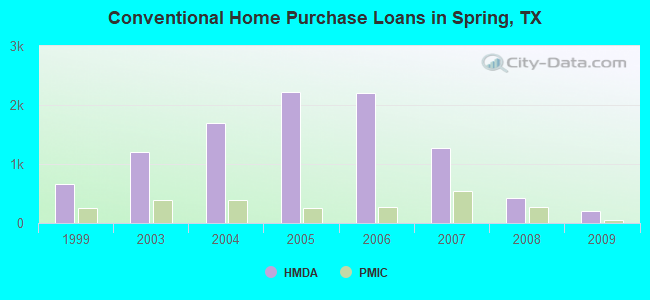
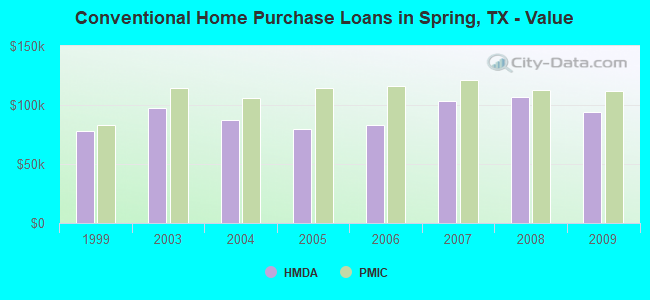
| Home Mortgage Disclosure Act Aggregated Statistics For Year 2009 (Based on 5 full tracts) | ||||||||||||
| A) FHA, FSA/RHS & VA Home Purchase Loans | B) Conventional Home Purchase Loans | C) Refinancings | D) Home Improvement Loans | F) Non-occupant Loans on < 5 Family Dwellings (A B C & D) | G) Loans On Manufactured Home Dwelling (A B C & D) | |||||||
|---|---|---|---|---|---|---|---|---|---|---|---|---|
| Number | Average Value | Number | Average Value | Number | Average Value | Number | Average Value | Number | Average Value | Number | Average Value | |
| LOANS ORIGINATED | 557 | $120,194 | 195 | $94,130 | 403 | $120,753 | 27 | $25,807 | 96 | $67,380 | 1 | $77,000 |
| APPLICATIONS APPROVED, NOT ACCEPTED | 18 | $110,026 | 18 | $110,368 | 54 | $111,869 | 4 | $31,992 | 8 | $66,088 | 0 | $0 |
| APPLICATIONS DENIED | 96 | $119,088 | 42 | $92,099 | 314 | $108,095 | 90 | $27,659 | 37 | $71,429 | 4 | $72,895 |
| APPLICATIONS WITHDRAWN | 84 | $118,254 | 40 | $104,614 | 159 | $119,568 | 15 | $73,549 | 23 | $75,613 | 0 | $0 |
| FILES CLOSED FOR INCOMPLETENESS | 23 | $122,393 | 7 | $83,031 | 46 | $114,581 | 8 | $40,860 | 5 | $90,600 | 0 | $0 |
Detailed HMDA statistics for the following Tracts:2410.00,2411.00,2412.00,2413.00,2414.00
| Private Mortgage Insurance Companies Aggregated Statistics For Year 2009 (Based on 5 full tracts) | ||||||
| A) Conventional Home Purchase Loans | B) Refinancings | C) Non-occupant Loans on < 5 Family Dwellings (A & B) | ||||
|---|---|---|---|---|---|---|
| Number | Average Value | Number | Average Value | Number | Average Value | |
| LOANS ORIGINATED | 47 | $111,860 | 16 | $152,894 | 0 | $0 |
| APPLICATIONS APPROVED, NOT ACCEPTED | 20 | $101,141 | 7 | $122,034 | 4 | $71,500 |
| APPLICATIONS DENIED | 6 | $107,363 | 2 | $151,795 | 0 | $0 |
| APPLICATIONS WITHDRAWN | 1 | $109,000 | 1 | $145,580 | 0 | $0 |
| FILES CLOSED FOR INCOMPLETENESS | 2 | $80,880 | 2 | $86,000 | 1 | $82,760 |
Detailed PMIC statistics for the following Tracts:2410.00,2411.00,2412.00,2413.00,2414.00
2002 - 2018 National Fire Incident Reporting System (NFIRS) incidents
- Fire incident types reported to NFIRS in Spring, TX
- 4,76544.4%Outside Fires
- 4,02837.5%Structure Fires
- 1,56214.6%Mobile Property/Vehicle Fires
- 3753.5%Other
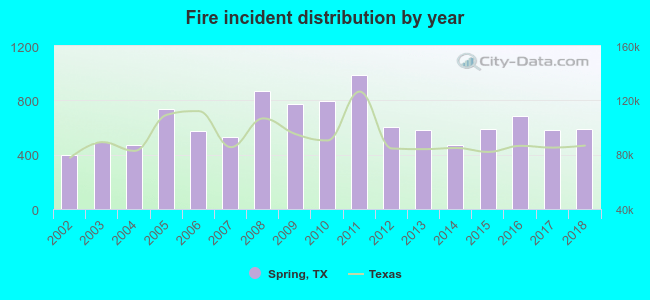 Based on the data from the years 2002 - 2018 the average number of fire incidents per year is 631. The highest number of fire incidents - 988 took place in 2011, and the least - 401 in 2002. The data has a growing trend.
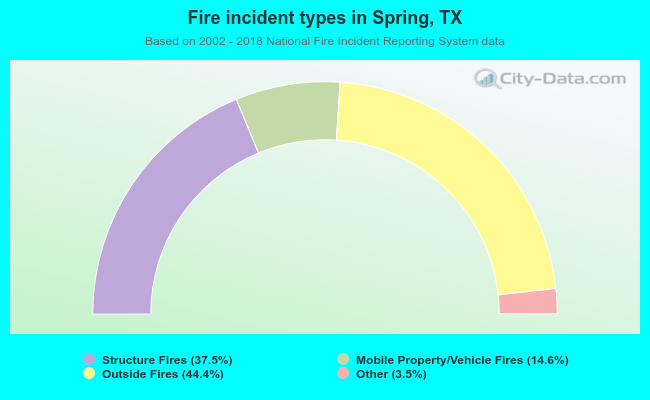 When looking into fire subcategories, the most reports belonged to: Outside Fires (44.4%), and Structure Fires (37.5%).
Fire-safe hotels and motels in Spring, Texas:
- Motel 6 #1261 Spring, 19606 Cypresswood CT, Spring, Texas 77388,Phone: (281) 350-6400
- Super 8, 24903 I-45 N, Spring, Texas 77380,Phone: (281) 367-5040,Fax: (281) 367-3729
- Extended Stay America - Houston - The Woodlands, 150 Vly Wood Rd, Spring, Texas 77380,Phone: (281) 296-2799,Fax: (281) 296-2822
- Residence Inn The Woodlands II, 9333 Six Pines Dr, Spring, Texas 77380,Phone: (281) 419-1542
- Comfort Suites, 323 E Louetta Rd, Spring, Texas 77373,Phone: (281) 288-5515,Fax: (281) 288-5585
- Fairfield Inn & Suites Houston The Woodlands South, 24485 Interstate 45 N, Spring, Texas 77386,Phone: (281) 719-8460,Fax: (281) 719-8045
- Homewood Suites by Hilton The Woodlands / Springwoods Village, 23800 Interstate 45 N, Spring, Texas 77373,Phone: (832) 823-7500
- Residence Inn by Marriott Springwoods Village, 22814 Holzwarth Rd, Spring, Texas 77389,Phone: (800) 831-0224,Fax: (281) 353-2238
- 9other hotels and motels
| Most common first names in Spring, TX among deceased individuals | ||
| Name | Count | Lived (average) |
|---|---|---|
| Mary | 415 | 79.4 years |
| John | 349 | 72.1 years |
| James | 313 | 70.7 years |
| Robert | 300 | 71.0 years |
| William | 289 | 73.8 years |
| Charles | 195 | 72.0 years |
| Dorothy | 194 | 80.4 years |
| Margaret | 150 | 79.6 years |
| Helen | 143 | 82.1 years |
| George | 139 | 76.7 years |
| Most common last names in Spring, TX among deceased individuals | ||
| Last name | Count | Lived (average) |
|---|---|---|
| Smith | 186 | 73.7 years |
| Johnson | 121 | 73.5 years |
| Williams | 109 | 72.8 years |
| Jones | 94 | 76.9 years |
| Brown | 81 | 74.4 years |
| Davis | 71 | 73.7 years |
| Miller | 64 | 72.6 years |
| Wilson | 60 | 79.9 years |
| Martin | 54 | 73.5 years |
| Moore | 53 | 72.7 years |
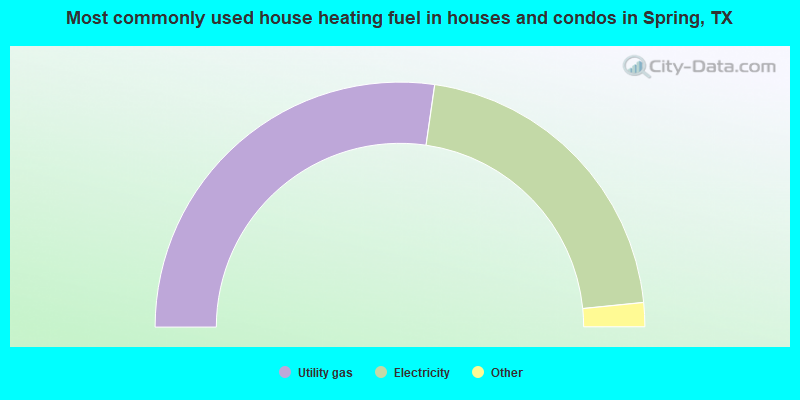
- 57.3%Utility gas
- 39.2%Electricity
- 2.2%Bottled, tank, or LP gas
- 0.7%Fuel oil, kerosene, etc.
- 0.3%Solar energy
- 0.2%No fuel used
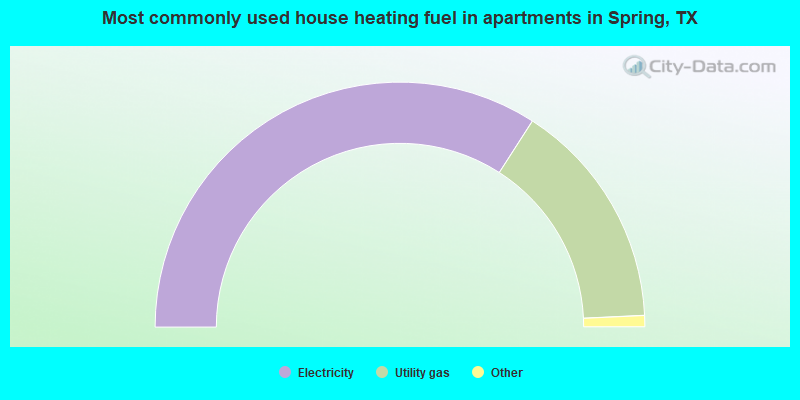
- 68.4%Electricity
- 30.0%Utility gas
- 1.4%No fuel used
- 0.2%Bottled, tank, or LP gas
Spring compared to Texas state average:
- Unemployed percentage significantly belowstate average.
- Black race population percentage significantly abovestate average.
- Hispanic race population percentage abovestate average.
- Foreign-born population percentage abovestate average.
Spring on ourtop lists:
- #3on the list of "Top 101 cities with largest percentage of females in occupations: office and administrative support occupations (population 50,000+)"
- #4on the list of "Top 100 cities with lowest ratio of median house value to median household income (pop. 50,000+)"
- #9on the list of "Top 101 cities with largest percentage of females in industries: transportation and warehousing (population 50,000+)"
- #10on the list of "Top 101 cities with largest percentage of females in industries: mining, quarrying, and oil and gas extraction (population 50,000+)"
- #11on the list of "Top 101 cities with largest percentage of males in industries: transportation and warehousing (population 50,000+)"
- #13on the list of "Top 101 cities with largest percentage of males in occupations: installation, maintenance, and repair occupations (population 50,000+)"
- #16on the list of "Top 101 cities with the smallest household incomes disparities (population 50,000+)"
- #17on the list of "Top 101 cities that people commute from (largest negative percentage daily daytime population change due to commuting) (population 50,000+)"
- #24on the list of "Top 101 cities with the least people having professional degrees (population 50,000+)"
- #25on the list of "Top 100 low-educated but high-earning cities (pop. 50,000+)"
- #32on the list of "Top 101 cities with largest percentage of females in occupations: transportation occupations (population 50,000+)"
- #33on the list of "Top 101 cities with largest percentage of males in industries: mining, quarrying, and oil and gas extraction (population 50,000+)"
- #34on the list of "Top 101 cities with the highest average humidity (population 50,000+)"
- #39on the list of "Top 101 cities with largest percentage of males in occupations: fire fighting and prevention workers including supervisors (population 50,000+)"
- #49on the list of "Top 101 cities with the smallest percentage of elementary and middle school students in private schools (5,000+ students)"
- #60on the list of "Top 101 cities with the most users submitting photos to our site per 10,000 residents (population 50,000+)"
- #64on the list of "Top 100 cities with highest median household income and median resident age less than 35 (pop. 50,000+)"
- #67on the list of "Top 101 cities with the highest maximum monthly morning or afternoon humidity (population 50,000+)"
- #72on the list of "Top 101 cities with the most mentions on city-data.com forum"
- #75on the list of "Top 101 cities with the smallest house values disparities (population 50,000+)"
- #1on the list of "Top 101 counties with the most Mainline Protestant adherents"
- #1on the list of "Top 101 counties with the most Evangelical Protestant adherents"
- #2on the list of "Top 101 counties with the most Evangelical Protestant congregations"
- #3on the list of "Top 101 counties with the highest ground withdrawal of fresh water for public supply"
- #6on the list of "Top 101 counties with the most Mainline Protestant congregations (pop. 50,000+)"

|
|
Total of 4280 patent applications in 2008-2025.
City-data.com does not guarantee the accuracy or timeliness of any information on this site. Use at your own risk.
Website © 2025 Advameg, Inc.
[8]ページ先頭