Uh oh!
There was an error while loading.Please reload this page.
- Notifications
You must be signed in to change notification settings - Fork247
Fix Javascript Firefox configuration code block
- C/C++/Rust (via lldb-vscode)
- C/C++/Rust (via vscode-cpptools)
- C/C++/Rust (via codelldb)
- Go
- Go (using delve directly)
- Java
- Mockdebug
- Python
- Ruby
- Dart
- Haskell
- Javascript/Node
- Javascript/Chrome
- Javascript/Firefox
- PHP
- Scala
- Neovim Lua
- .NET (csharp, fsharp)
- Unity
- Elixir
- Godot gdscript
- Bash via bashdb
Some examples below are in lua, if you want to set upnvim-dap in a.vim file, you have to wrap the code blocks like this:
lua <<EOF-- lua code goes hereEOFSee:help lua-commands
Installdebugpy into a virtualenv
mkdir .virtualenvscd .virtualenvspython -m venv debugpydebugpy/bin/python -m pip install debugpyYou can then either usenvim-dap-python - it comes with adapter and configurations definitions - or define them manually as follows:
localdap=require('dap')dap.adapters.python= {type='executable';command='path/to/virtualenvs/debugpy/bin/python';args= {'-m','debugpy.adapter'};}
localdap=require('dap')dap.configurations.python= { {-- The first three options are required by nvim-daptype='python';-- the type here established the link to the adapter definition: `dap.adapters.python`request='launch';name="Launch file";-- Options below are for debugpy, see https://github.com/microsoft/debugpy/wiki/Debug-configuration-settings for supported optionsprogram="${file}";-- This configuration will launch the current file if used.pythonPath=function()-- debugpy supports launching an application with a different interpreter then the one used to launch debugpy itself.-- The code below looks for a `venv` or `.venv` folder in the current directly and uses the python within.-- You could adapt this - to for example use the `VIRTUAL_ENV` environment variable.localcwd=vim.fn.getcwd()ifvim.fn.executable(cwd..'/venv/bin/python')==1thenreturncwd..'/venv/bin/python'elseifvim.fn.executable(cwd..'/.venv/bin/python')==1thenreturncwd..'/.venv/bin/python'elsereturn'/usr/bin/python'endend; },}
You can refer to the virtualenv environment variable with
command = os.getenv("VIRTUAL_ENV") .."/bin/python"
C/C++/Rust (viavscode-cpptools)
Moved toC/C++/Rust (cpptools)
C/C++/Rust (viacodelldb)
Modern LLDB installations come with a binary calledlldb-vscode (orlldb-vscode-11).For the following to work, make sure the binarieslldb-vscode depends on (llvm-symbolizer) are in yourPATH.
Adapter:
localdap=require('dap')dap.adapters.lldb= {type='executable',command='/usr/bin/lldb-vscode',-- adjust as needed, must be absolute pathname='lldb'}
Configurations:
localdap=require('dap')dap.configurations.cpp= { {name='Launch',type='lldb',request='launch',program=function()returnvim.fn.input('Path to executable:',vim.fn.getcwd()..'/','file')end,cwd='${workspaceFolder}',stopOnEntry=false,args= {},-- 💀-- if you change `runInTerminal` to true, you might need to change the yama/ptrace_scope setting:---- echo 0 | sudo tee /proc/sys/kernel/yama/ptrace_scope---- Otherwise you might get the following error:---- Error on launch: Failed to attach to the target process---- But you should be aware of the implications:-- https://www.kernel.org/doc/html/latest/admin-guide/LSM/Yama.html-- runInTerminal = false, },}-- If you want to use this for Rust and C, add something like this:dap.configurations.c=dap.configurations.cppdap.configurations.rust=dap.configurations.cpp
If you want to be able to attach to running processes, add another configuration entry like described here:
You can find more configurations options here:
- https://github.com/llvm/llvm-project/tree/main/lldb/tools/lldb-vscode#configurations
- https://github.com/llvm/llvm-project/blob/release/11.x/lldb/tools/lldb-vscode/package.json
lldb-vscode by default doesn't inherit the environment variables from the parent. If you want to inherit them, add theenv property definition below to yourconfigurations entries.
env=function()localvariables= {}fork,vinpairs(vim.fn.environ())dotable.insert(variables,string.format("%s=%s",k,v))endreturnvariablesend,
You can execute LLDB debugger commands such asbt,parray orregister read rax on thedap> command line by prefixing them with` (for example`bt).
Adapted frombuild instructions for clangd
For a minimal setup on building lldb-vscode:
Clone the LLVM repo to
$LLVM_ROOT.Create a build directory, for example at
$LLVM_ROOT/build.Inside the build directory run:
cmake $LLVM_ROOT/llvm/ -DCMAKE_BUILD_TYPE=Release -DLLVM_ENABLE_PROJECTS="lldb" -G Ninja.- We suggest building in
Releasemode as building DEBUG binaries requiresconsiderably more resources. You can checkBuilding LLVM with CMake documentationfor more details about cmake flags.
- We suggest building in
Afterwards you can build lldb-vscode with
cmake --build $LLVM_ROOT/build --target lldb-vscode.same for lldb-server
cmake --build $LLVM_ROOT/build --target lldb-server.
An easy way to installlldb-vscode is to usebrew
$ brew install llvm
Then executable filelldb-vscode andlldb-server are under this path$(brew --prefix llvm)/bin.
Vscode offers amock implementation for a debug adapter for testing. It can "debug" READMEs.
Clone the repo and run npm:
git clone https://github.com/Microsoft/vscode-mock-debug.gitcd vscode-mock-debugnpm installAdd the adapter and configuration:
localdap=require"dap"dap.adapters.markdown= {type="executable",name="mockdebug",command="node",args= {"./out/debugAdapter.js"},cwd="path/to/vscode-mock-debug/" }dap.configurations.markdown= { {type="mock",request="launch",name="mock test",program="/path/to/a/readme.md",stopOnEntry=true,debugServer=4711 } }
Installdelve
go install github.com/go-delve/delve/cmd/dlv@latest- or via package manager (
pacman -S delve)
Installvscode-go
git clone https://github.com/golang/vscode-gocd vscode-gonpm installnpm run compile
Add the adapter and configuration:
dap.adapters.go= {type='executable';command='node';args= {os.getenv('HOME')..'/dev/golang/vscode-go/dist/debugAdapter.js'};}dap.configurations.go= { {type='go';name='Debug';request='launch';showLog=false;program="${file}";dlvToolPath=vim.fn.exepath('dlv')-- Adjust to where delve is installed },}
Newer version of delve experimentally implement the DAP directly so that it can be used without installing vscode-go.More info
Install delve:
go install github.com/go-delve/delve/cmd/dlv@latest- or via package manager. For example
pacman -S delve
Once delve is installed you can usenvim-dap-go (a nvim-dap extension) to automatically configuredelve running in dap mode. The extension also allows debugging individual Go tests.
If you prefer to provide your own configuration, you will need to setup thedap.adapters.go and thedap.configurations.go like:
dap.adapters.delve= {type='server',port='${port}',executable= {command='dlv',args= {'dap','-l','127.0.0.1:${port}'}, }}-- https://github.com/go-delve/delve/blob/master/Documentation/usage/dlv_dap.mddap.configurations.go= { {type="delve",name="Debug",request="launch",program="${file}" }, {type="delve",name="Debug test",-- configuration for debugging test filesrequest="launch",mode="test",program="${file}" },-- works with go.mod packages and sub packages {type="delve",name="Debug test (go.mod)",request="launch",mode="test",program="./${relativeFileDirname}" } }
If you prefer to start delve manually, you can use the following adapter definition instead:
dap.adapters.delve= {type="server",host="127.0.0.1",port=38697, }
And start delve like this:
dlv dap -l 127.0.0.1:38697 --log --log-output="dap"Vianvim-dap-ruby or manually:
Adddebug to yourGemfile
dap.adapters.ruby=function(callback,config)callback {type="server",host="127.0.0.1",port="${port}",executable= {command="bundle",args= {"exec","rdbg","-n","--open","--port","${port}","-c","--","bundle","exec",config.command,config.script, }, }, }enddap.configurations.ruby= { {type="ruby",name="debug current file",request="attach",localfs=true,command="ruby",script="${file}", }, {type="ruby",name="run current spec file",request="attach",localfs=true,command="rspec",script="${file}", },}
- Installreadapt
- Add the adapter and configuration:
localdap=require('dap')dap.adapters.ruby= {type='executable';command='bundle';args= {'exec','readapt','stdio'};}dap.configurations.ruby= { {type='ruby';request='launch';name='Rails';program='bundle';programArgs= {'exec','rails','s'};useBundler=true; },}
Seehttps://github.com/puremourning/vimspector/issues/4 for reference.
This installation might change over time as the debugger doesn't officially supportbeing used as a standalone, but the maintainer is trying to be accomodating however the path to the executableor the variables might change in the future
ensure you havenode installed
- git clone
Dart-Code(the debug adapter is not avaliable as a standalone) - cd into the
Dart-Codedirectory and runnpx webpack --mode production - this will create
out/dist/debug.jswhich is the executable file
NOTE: yourflutterSdkPath might not be in~/ this can vary depending on your installation method e.g.snap
dap.adapters.dart= {type="executable",command="node",args= {"<path-to-Dart-Code>/out/dist/debug.js","flutter"} }dap.configurations.dart= { {type="dart",request="launch",name="Launch flutter",dartSdkPath=os.getenv('HOME').."/flutter/bin/cache/dart-sdk/",flutterSdkPath=os.getenv('HOME').."/flutter",program="${workspaceFolder}/lib/main.dart",cwd="${workspaceFolder}", } }
- Installhaskell-debug-adapter
stack install haskell-dap ghci-dap haskell-debug-adapter
- Add the adapter and configuration:
dap.adapters.haskell= {type='executable';command='haskell-debug-adapter';args= {'--hackage-version=0.0.33.0'};}dap.configurations.haskell= { {type='haskell',request='launch',name='Debug',workspace='${workspaceFolder}',startup="${file}",stopOnEntry=true,logFile=vim.fn.stdpath('data')..'/haskell-dap.log',logLevel='WARNING',ghciEnv=vim.empty_dict(),ghciPrompt="λ:",-- Adjust the prompt to the prompt you see when you invoke the stack ghci command belowghciInitialPrompt="λ:",ghciCmd="stack ghci --test --no-load --no-build --main-is TARGET --ghci-options -fprint-evld-with-show", },}
Installnode-debug2
mkdir -p ~/dev/microsoftgit clone https://github.com/microsoft/vscode-node-debug2.git ~/dev/microsoft/vscode-node-debug2cd ~/dev/microsoft/vscode-node-debug2npm installNODE_OPTIONS=--no-experimental-fetch npm run build
Add the adapter and configuration:
localdap=require('dap')dap.adapters.node2= {type='executable',command='node',args= {os.getenv('HOME')..'/dev/microsoft/vscode-node-debug2/out/src/nodeDebug.js'},}dap.configurations.javascript= { {name='Launch',type='node2',request='launch',program='${file}',cwd=vim.fn.getcwd(),sourceMaps=true,protocol='inspector',console='integratedTerminal', }, {-- For this to work you need to make sure the node process is started with the `--inspect` flag.name='Attach to process',type='node2',request='attach',processId=require'dap.utils'.pick_process, },}
Usingvscode-js-debug insteadofnode-debug2 is not supported directly because it requires undocumenteddebug-adapter-protocol extensions. Seehttps://github.com/microsoft/vscode-js-debug/issues/969
There is, however, a language specific extensionnvim-dap-vscode-js which provides support for these dap extensions. See the documentation on that repo for installation instructions.
build vscode-chrome-debug
- git clonehttps://github.com/Microsoft/vscode-chrome-debug
- cd ./vscode-chrome-debug
- npm install
- npm run build
add the adapter cfg:
dap.adapters.chrome= {type="executable",command="node",args= {os.getenv("HOME").."/path/to/vscode-chrome-debug/out/src/chromeDebug.js"}-- TODO adjust}dap.configurations.javascriptreact= {-- change this to javascript if needed {type="chrome",request="attach",program="${file}",cwd=vim.fn.getcwd(),sourceMaps=true,protocol="inspector",port=9222,webRoot="${workspaceFolder}" }}dap.configurations.typescriptreact= {-- change to typescript if needed {type="chrome",request="attach",program="${file}",cwd=vim.fn.getcwd(),sourceMaps=true,protocol="inspector",port=9222,webRoot="${workspaceFolder}" }}
note: chrome has to be started with a remote debugging portgoogle-chrome-stable --remote-debugging-port=9222
- build vscode-firefox-debug
- git clonehttps://github.com/firefox-devtools/vscode-firefox-debug.git
- cd vscode-firefox-debug
- npm install
- npm run build
adapter.bundle.js depends on other files from the dist folder. If you want to change the output files' location, make sure you copy the whole dist folder -DO NOT try to copy adapter.bundle.json its own to some other folder.
- add the adapter cfg:
localdap=require('dap')dap.adapters.firefox= {type='executable',command='node',args= {os.getenv('HOME')..'/path/to/vscode-firefox-debug/dist/adapter.bundle.js'},}dap.configurations.typescript= { {name='Debug with Firefox',type='firefox',request='launch',reAttach=true,url='http://localhost:3000',webRoot='${workspaceFolder}',firefoxExecutable='/usr/bin/firefox' }}
Installvscode-php-debug:
git clone https://github.com/xdebug/vscode-php-debug.gitcd vscode-php-debugnpm install && npm run build
If you have not configured Xdebug, readInstallation atvscode-php-debug.
Add the adapter configuration:
dap.adapters.php= {type='executable',command='node',args= {'/path/to/vscode-php-debug/out/phpDebug.js'}}dap.configurations.php= { {type='php',request='launch',name='Listen for Xdebug',port=9000 }}
Supported configuration options for PHP can be found underSupported launch.json settings at thevscode-php-debug repo.
Possible vianvim-metals
Possible viaone-small-step-for-vimkind
Installnetcoredbg, either via:
- Your package manager
- Downloading it from the release page and extracting it to a folder
- Building from source by following the instructions in the netcoredbg repo.
Add the adapter configuration:
dap.adapters.coreclr= {type='executable',command='/path/to/dotnet/netcoredbg/netcoredbg',args= {'--interpreter=vscode'}}
Add a configuration:
dap.configurations.cs= { {type="coreclr",name="launch - netcoredbg",request="launch",program=function()returnvim.fn.input('Path to dll',vim.fn.getcwd()..'/bin/Debug/','file')end, },}
Installvscode-unity-debug
Installmono dependency if doesn't exist
Add the adapter configuration:
dap.adapters.unity= {type='executable',command='<path-to-mono-directory>/Commands/mono',args= {'<path-to-unity-debug-directory>/unity.unity-debug-x.x.x/bin/UnityDebug.exe'}}
Add a configuration:
dap.configurations.cs= { {type='unity',request='attach',name='Unity Editor', }}
Installelixir-ls.
Add the adapter configuration:
dap.adapters.mix_task= {type='executable',command='/path/to/elixir-ls/debugger.sh',-- debugger.bat for windowsargs= {}}
Add a configuration (see configuration options):
dap.configurations.elixir= { {type="mix_task",name="mix test",task='test',taskArgs= {"--trace"},request="launch",startApps=true,-- for Phoenix projectsprojectDir="${workspaceFolder}",requireFiles= {"test/**/test_helper.exs","test/**/*_test.exs" } },}
Godot 4.0 includes support for the debug adapter protocol.
You need to have a Godot instance running to use it.
Adapter definition:
localdap=require('dap')dap.adapters.godot= {type="server",host='127.0.0.1',port=6006,}
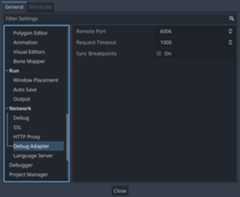
The port must match the Godot setting. Go toEditor ->Editor Settings,then findDebug Adapter underNetwork:
Configuration:
dap.configurations.gdscript= { {type="godot",request="launch",name="Launch scene",project="${workspaceFolder}",launch_scene=true, }}
See theConfiguration section in thegodot-vscode-pluginREADME for a description of the configuration properties.
Add the adapter configuration :
dap.adapters.bashdb= {type='executable';command=vim.fn.stdpath("data")..'/mason/packages/bash-debug-adapter/bash-debug-adapter';name='bashdb';}
Add the configuration :
dap.configurations.sh= { {type='bashdb';request='launch';name="Launch file";showDebugOutput=true;pathBashdb=vim.fn.stdpath("data")..'/mason/packages/bash-debug-adapter/extension/bashdb_dir/bashdb';pathBashdbLib=vim.fn.stdpath("data")..'/mason/packages/bash-debug-adapter/extension/bashdb_dir';trace=true;file="${file}";program="${file}";cwd='${workspaceFolder}';pathCat="cat";pathBash="/bin/bash";pathMkfifo="mkfifo";pathPkill="pkill";args= {};env= {};terminalKind="integrated"; }}