Uh oh!
There was an error while loading.Please reload this page.
- Notifications
You must be signed in to change notification settings - Fork62
230+ check plugins for Icinga and other Nagios-compatible monitoring applications. Each plugin is a standalone command line tool (written in Python) that provides a specific type of check.
License
Linuxfabrik/monitoring-plugins
Folders and files
| Name | Name | Last commit message | Last commit date | |
|---|---|---|---|---|
Repository files navigation

Check Plugin Collection for Nagios, Icinga and others•made byLinuxfabrik
This Enterprise Class Check Plugin Collection made byLinuxfabrik offers a package of Python-based, Nagios-compatible check plugins for Icinga, Naemon, Nagios, OP5, Shinken, Sensu and other monitoring applications. Each plugin is a stand-alone command line tool that provides a specific type of check. Typically, your monitoring software will run these check plugins to determine the current status of hosts and services on your network.
All plugins are written in Python and licensed under theUNLICENSE, a licence that dedicates works to the public domain with no conditions whatsoever. They run on all platforms that support Python 3.9 and above, like Linux, Windows, MacOS, FreeBSD and others. For Windows, there are compiled plugins available, meaning you don't need Python.
The plugins are fast and reliable, using as few system resources as possible. They report the same metrics consistently and uniformly on all platforms (for example, they always use 'used' instead of a mixture of 'used' and 'free'). Where possible, automatic detection and auto-discovery mechanisms are built in. The plugins use meaningful default settings to trigger WARNs and CRITs only where absolutely necessary. In addition, many plugins offer troubleshooting information. We avoid dependencies on third-party system libraries wherever possible.
Visiticinga-demo.linuxfabrik.ch.
The source code is published here without support. If you need Enterprise Support, pleaseconclude a Service Contract.
Do you think more people should know about it? Sharing is caring, so feel free to spread the word. We would really appreciate if you share this on any social media, or link this site on any blog or forum.It would also be great if you could tell on GitHub discussions how you use the plugins.
- Have a look at theINSTALL document for the various options, including SELinux etc.
- For details on installing the plugins in Icinga Director, seeICINGA.
If you want to run your own instance of Icinga, you could set it up in a few clicks using the infrastructure provider Exoscale. We provide the images at theExoscale Marketplace. Alternatively, you can set up a self-hosted Icinga infrastructure using ourLFOps Ansible collection.
For now, there are two ways:
- Submit an issue (preferred).
- Contact us by email or web form and describe your problem.
For reporting a vulnerability issue, seeSECURITY.
This Open Source project is not being developed according to a fixed roadmap. We do not provide any information about timelines, and even if we did, there would be no guarantee that they would be met. The content of milestones may change according to our customers' needs.
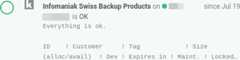
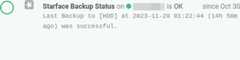
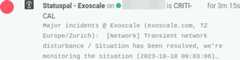
See some of our check plugins at a glance on an Icinga server:


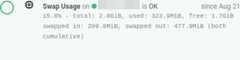
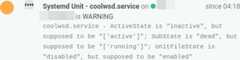


If you zoom in, for example onCPU Usage:

Some comments from the community about our monitoring plugins:
First, I just wanted to say thanks for your great work on these plugins. Great collection that cover a lot of bases!
We replaced all checks from the Icinga Powershell Framework with the Linuxfabrik equivalents. Much faster and a heavily reduced memory footprint. Great work!
--jprusch
Thanks again @linuxfabrik for writing the csv-values check the way you did and not what I originally requested ;-)
... the Linuxfabrik-Monitoring-Plugins are great, thanks for your effort, we are using them very much.
... thanks for your awesome plugins.
... Thanks for your awesome work & have a good day.
--\Barney
... the Linux fabrik plugins are excellent.
... I can recommend this family of plugins, they are the highest quality I have seen around. ...
Ich bin vor kurzem (via Video vom Icinga Camp) über Eure Monitoringplugins gestolpert. Ganz herzlichen Dank dafür, großartige Arbeit!!
-- Christian Lox
... many thanks for your great collection of monitoring plugins! I've just found them - clean structure and output, cross-platform, Icinga Directory Basket configurations - loving it and currently migrating step by step most of my checks to use them where possible. 😍
Nachdem ich beim Versuch, Nagios-Plugins auf VMwares Photon-OS zum laufen zu kriegen, graue Haare gekriegt habe, haben mir eure Plugins zum Ziel verholfen.
A well engineered, regularly updated and maintained collection of plugins. Specially focused on Linux servers/VMs and used at large scale by the company developing it.
Hello, I stumbled across your collection and am thrilled! Especially the extensive documentary and the Director Baskets are a dream.
-- Stefan Beining
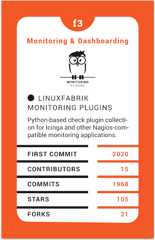
The "Linuxfabrik Monitoring Plugins" on a card of our popular Open Source Quartet from 2023 🙂. Sold out, but there's still more to discover in theLinuxfabrik Spreadshop.
Regarding the check plugin output, this is how we convert and append symbols to large numbers in a human-readable format (according to WikipediaNames of large numbers, and other).
Since the primary hosting platform is Linux, which uses IEC, the plugins display byte sizes in powers of 2 (KiB, MiB, GiB etc.) - otherwise it would be very confusing to have the monitoring plugins said something different than the command line.
| Value | Symbol | Origin | Type | Description |
|---|---|---|---|---|
| 1000^1 | K | Number | Thousand | |
| 1000^2 | M | SI Symbol | Number | Million (1), Million (2) |
| 1000^3 | G | SI Symbol | Number | Milliard (1), Billion (2) |
| 1000^4 | T | SI Symbol | Number | Billion (1), Trillion (2) |
| 1000^5 | P | SI Symbol | Number | Billiard (1), Quadrillion (2) |
| 1000^6 | E | SI Symbol | Number | Trillion (1), Quintillion (2) |
| 1000^7 | Z | SI Symbol | Number | Trilliard (1), Sextillion (2) |
| 1000^8 | Y | SI Symbol | Number | Quadrillion (1), Septillion (2) |
| 1024^0 | B | Bytes | Bytes | |
| 1024^1 | KiB | IEC unit | Bytes | Kibibytes |
| 1024^2 | MiB | IEC unit | Bytes | Mebibytes |
| 1024^3 | GiB | IEC unit | Bytes | Gibibytes |
| 1024^4 | TiB | IEC unit | Bytes | Tebibytes |
| 1024^5 | PiB | IEC unit | Bytes | Pebibytes |
| 1024^6 | EiB | IEC unit | Bytes | Exbibytes |
| 1024^7 | ZiB | IEC unit | Bytes | Zebibytes |
| 1024^8 | YiB | IEC unit | Bytes | Yobibytes |
| 1000^1 | KB | Bytes | Kilobytes | |
| 1000^2 | MB | Bytes | Megabytes | |
| 1000^3 | GB | Bytes | Gigabytes | |
| 1000^4 | TB | Bytes | Terrabytes | |
| 1000^5 | PB | Bytes | Petabytes | |
| 1000^6 | EB | Bytes | Exabytes | |
| 1000^7 | ZB | Bytes | Zetabytes | |
| 1000^8 | YB | Bytes | Yottabytes | |
| 1000^1 | Kbps | Bits per Second | Kilobits | |
| 1000^2 | Mbps | Bits per Second | Megabits | |
| 1000^3 | Gbps | Bits per Second | Gigabits | |
| 1000^4 | Tbps | Bits per Second | Terrabits | |
| 1000^5 | Pbps | Bits per Second | Petabits | |
| 1000^6 | Ebps | Bits per Second | Exabits | |
| 1000^7 | Zbps | Bits per Second | Zetabits | |
| 1000^8 | Ybps | Bits per Second | Yottabits | |
| 1e-12 | ps | Time | Picoseconds | |
| 1e-9 | ns | Time | Nanoseconds | |
| 1e-6 | us | Time | Microseconds | |
| 1e-3 | ms | Time | Milliseconds | |
| 1..59 | s | Time | Seconds | |
| 60 | m | Time | Minutes | |
| 60*60 | h | Time | Hours | |
| 60*60*24 | D | Time | Days | |
| 60*60*24*7 | W | Time | Weeks | |
| 60*60*24*30 | M | Time | Months | |
| 60*60*24*365 | Y | Time | Years |
- (1): Traditional European (Peletier, long scale)
- (2): US, Canada and modern British (short scale)
If a check supports Nagios ranges, they can be used as follows:
- Simple value: A range from 0 up to and including the value.
- A "Range" is the same as onnagios-plugins.org:... defined as a start and end point (inclusive) on a numeric scale (possibly negative or positive infinity)., in the format
start:end. - Empty value after
:: Positive infinity. ~: Negative infinity.@: Like a NOT for the whole expression. So if range starts with@, then alert if inside this range (including endpoints).
Examples:
| -w, -c | OK if result is | WARN/CRIT if |
|---|---|---|
| 10 | in (0..10) | not in (0..10) |
| -10 | in (-10..0) | not in (-10..0) |
| 10: | in (10..inf) | not in (10..inf) |
| : | in (0..inf) | not in (0..inf) |
| ~:10 | in (-inf..10) | not in (-inf..10) |
| 10:20 | in (10..20) | not in (10..20) |
| @10:20 | not in (10..20) | in 10..20 |
| @~:20 | not in (-inf..20) | in (-inf..20) |
| @ | not in (0..inf) | in (0..inf) |
Shell commands like./file-age --filename='/tmp/*' have two basic parts:
- Command name of the program to run (
./file-age). May be followed by one or more options, which adjust the behavior of the command or what it will do. - Options/Parameters normally start with one or two dashes to distinguish them from arguments (parameter
--filename, value'/tmp/*'). They adjust the behavior of the command. Parameters may be short (-w) or long (--warning). We prefer and often offer only the long version.
Many shell commands may also be followed by one or more arguments, which often indicate a target that the command should operate upon (useradd linus for example) . This does not apply to the check-plugins.
To avoid problems when passingparameter values that start with a-, the command line call must look like this:
- Long parameters:
./file-age --warning=-60:3600(use--param=valueinstead of--param value). - Short parameters:
./file-age -w-60:3600(so simply not putting any space nor escaping it in any special way).
└── plugin-name ├── assets Additional ressources, for example helper scripts like monitoring.php ├── grafana Grafana dashboard definition ├── icingaweb2-module-director Icinga Director basket definition ├── icingaweb2-module-grafana Grafana panel definition for Icinga's Grafana module ├── icon SVG icon for Web GUIs ├── lib Link to the Linuxfabrik Python libraries ├── unit-test File for unit tests │ ├── retc Files for simulating return codes │ ├── stdin Files for simulating output to STDOUT │ ├── stdout Files for simulating output to STDERR │ └── run The unit test └── plugin-name The monitoring plugin- When running from source, all check plugins are happy with Python 3.9+.
- All plugins define the
#!/usr/bin/env python3shebang.
Each plugin comes with an SVG icon, which you can find atgithub.com/Linuxfabrik/monitoring-plugins, in the "icon" directory below each plugin. For IcingaWeb2, put them in/usr/share/icingaweb2/public/img/icons/.
SeeGRAFANA
SeeCONTRIBUTING
SeeBUILD
Q:After an update, I get "Operational Error: no such column: ..., state UNKNOWN". On the next run, this disappears. What happened?
A: Some check plugins require SQLite database files to cache data or to calculate data over time. After an update it is possible that the check plugin uses a new schema, but the database file on disk hasn't been updated (we don't implement database migrations). So in case of an "OperationalError", which happens for example when the plugin tries to INSERT into an outdated table, the database library simply deletes the sqlite database file. It will then be recreated from scratch by the plugin on the next run, with the updated database structure.
Q:How can I remove the performance data after the| from the check output?
A: In Bash, use/usr/lib64/nagios/plugins/check-command | cut -f1 -d'|'
Q:Do the plugins also handle proxy environment variables likeHTTP_PROXY?
A: Yes,HTTP_PROXY,HTTPS_PROXY,http_proxy andhttp_proxy are automatically used by the Linuxfabrik monitoring plugins if they are set.
Q:Icinga does not seem to pass the environment variablehttp_proxy to the plugins. What am i doing wrong?
This has nothing to do with the Linuxfabrik monitoring plugins - the Icinga configuration needs to be adjusted here. You need to do some additional configuration to make custom environment variables generally available. According tothis Icinga community post you need to set them in/etc/icinga2/icinga2.conf:
template CheckCommand default { env.http_proxy = "http://username:password@proxy.example.com:port" env.https_proxy = "http://username:password@proxy.example.com:port"}If you are also usingsudo to call some plugins from within Icinga, you will also need to set this in your/etc/sudoers.d/whatever.sudoers:
Defaults env_keep += "http_proxy https_proxy"Pro tips:
- Note that you can't set environment variables in Icinga Director. Even if you are only using the Icinga Director, follow the steps above.
- Environment variables with the same name in both
/etc/environmentand/etc/icinga2/icinga2.confwill be overwritten by/etc/icinga2/icinga2.conf.
Q:All pipe characters| in the output of any plugin are replaced with!. Why?
A: We have to. The output syntax of Nagios plugins is fixed and not very flexible:
Output lines | Performance dataSo the| character is reserved to separate plugin output from performance data. There is no way to escape it - so we have to replace it with!.
Q:Negative values for plugin arguments cause problems in Icinga.
A: As of 2024-11, Icinga still passes parameter values to plugins without a leading=. This causes plugins to assume that parameters starting with negative values are additional but unknown arguments. In Icinga this can be avoided by prefixing the first minus sign of a value with a backslash\, which is later removed by thebase.py library (v2024112001+, v2.0.0.0+). So just use\-60 or\-60:-3600 instead of-60 or-60:-3600 (see#789).
Q:On Windows, sometimes Windows Defender randomly kills a plugin. Why?
A: Depending on your signature versions or the healthiness of your signature cache, the Microsoft Windows Defender might classify a check as malicious (for example ourservice.exe). Please follow the steps below to clear cached detections and obtain the latest malware definitions.
- Open command prompt as administrator and change directory to
c:\program files\windows defender - Run
MpCmdRun.exe -removedefinitions -dynamicsignatures - Run
MpCmdRun.exe -SignatureUpdate
Q:Do the OS packages have external dependencies?
A: No.
Q:Can I overwrite specific plugins with its source code variant, if all other plugins are installed by the OS package manager?
A: Of course. Just don't forget to install the libs either.
Q:Wondering about/usr/lib64/nagios/plugins/ on Debian/Ubuntu?
A: We are always using the path/usr/lib64/nagios/plugins/ on all Linux OS, even if the original Nagios-package installs itself to/usr/lib/nagios/plugins/. This is because adding a command withsudo in Icinga Director, one needs to use the full path of the plugin. See the followingGitHub issue.
Q:On Windows, some plugins result in0x80070005 (E_ACCESSDENIED).
A: When using the plugins in Icinga:According to the Icinga documentation the Icinga Agent runs as theNetwork Service user by default. This may result in0x80070005 (E_ACCESSDENIED) messages for some plugins. In this case,use JEA Profiles for Icinga for Windows and seeinstalling JEA for Windows.
About
230+ check plugins for Icinga and other Nagios-compatible monitoring applications. Each plugin is a standalone command line tool (written in Python) that provides a specific type of check.
Topics
Resources
License
Code of conduct
Contributing
Security policy
Uh oh!
There was an error while loading.Please reload this page.
Stars
Watchers
Forks
Sponsor this project
Uh oh!
There was an error while loading.Please reload this page.
Uh oh!
There was an error while loading.Please reload this page.