- Notifications
You must be signed in to change notification settings - Fork8
AbdeltwabMF/queueing-modelsim
Folders and files
| Name | Name | Last commit message | Last commit date | |
|---|---|---|---|---|
Repository files navigation
This software is designed to calculate the characteristics of different queues using the BMAP (Batch Markovian Arrival Process) as input, and deterministic queues characterized by units of input (i.e., customers) arriving at known points in time with fixed service intervals.
Queueing theory is a powerful tool for analyzing the daily phenomenon of waiting in line. Learn how to define queueing theory, its origins, significance, and real-life applications.
Typical examples include:
- Banks/supermarkets: waiting for service
- Computers: waiting for a response
- Public transport: waiting for a train or bus
Also known as Kendall's Notation with the formatA/B/C/D/E, where:
Arepresents the probability distribution for the arrival processBrepresents the probability distribution for the service processCrepresents the number of channels (servers)Drepresents the maximum number of customers allowed in the queueing system (either being served or waiting for service)Erepresents the maximum total number of customers
Common options forA andB are:
Mfor a Poisson arrival distribution (exponential inter-arrival distribution) or an exponential service time distributionDfor a deterministic or constant valueGfor a general distribution (with known mean and variance)
IfD andE are not specified, it is assumed that they are infinite.
Common symbols used include:
λfor the mean arrival rateµfor the mean service rate
- Install Python 3:
sudo apt install python3 - Install pip for Python 3:
sudo apt install python3-pip - Install required libraries:
sudo pip3 install tk matplotlib
Clone or download the repository using the following command:
git clone https://github.com/AbdeltwabMF/Queueing-ModelSim
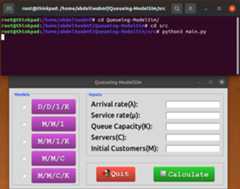
Navigate to the
Queueing-ModelSim/srcdirectory and runpython3 main.py.- Choose the queueing model you want to calculate:
D/D/1/K,M/M/1,M/M/1/K,M/M/C, orM/M/C/K. - Input the arrival rate (
λ) and service rates (µ). - Provide additional parameters such as the number of servers (
C) and maximum number of entities (KorM). - Press "Calculate".
- Choose the queueing model you want to calculate:
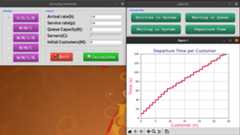
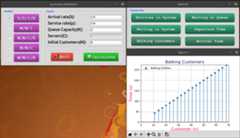
For Deterministic Queues (
D/D/1/K), a window will prompt you to choose the data you want to plot.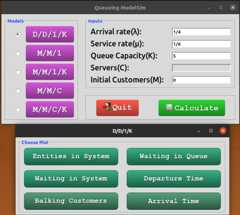


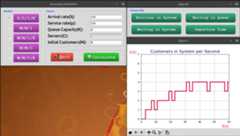
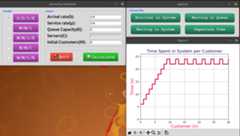
The following figures depict various aspects of the queueing system:
- Number of entities (customers) in the system at each unit of time.
- Time that customer n spends in the queue to be served.

- Time that customer n spends in the system until departure.
- Time of departure for each entity (customer).
- Customers who balked and corresponding processing time.
- Arrival time of each entity.


For Stochastic Models, a window will display server utilization (rho), average entities in the system (L), average entities in queue (Lq), average time an entity spends in the system (W), and average time an entity waits in line to be served (Wq).
Licensed under theGPL-3.0 License
About
Queueing Models Simulator.
Topics
Resources
License
Uh oh!
There was an error while loading.Please reload this page.