


Package ‘gginnards’ (Explore the innards of ‘ggplot2’) is a set ofextensions to R package ‘ggplot2’. Two geometries and two statistics arespecially useful when learning how to write ‘ggplot2’ extensions andwhen debugging newly defined statistics and geometries.
Note:ggplots were stored as objects ofclass"gg" with a list-like structure in ‘ggplot2’ (<4.0.0 ). In ‘ggplot2’ (>= 4.0.0)ggplots are stored asS7 objects of class"ggplot2:ggplot".
ggplots objects of these two classes contain both data and“instructions” to construct a plot and its layers. By editing theseobjects it is possible to modify or edit a ggplot in advance ofrendering. Functions are provided for the manipulation of layers withinggplot objects. These can be useful in the case of extensionsto ‘ggplot2’ that define functions that construct and return wholeggplot objects. In such cases in can be useful toprogramatically edit theseggplot objects to insert plot layersor change their order.
As the variables returned indata by many statisticsdepend on input, some of these tools can be also useful in everydayplotting with ‘gplot2’ as a way of diagnosing problems or gettinginformation that is missing from their documentation or only availableat runtime.
Because of its nature, this package does not always play safe andnice even if it tries to. No exported or internal function or objectshould be imported or used in other packages, simply because they maychange at any time (as in version 0.2.0). Although I intend to maintainthe package, I will not attempt to actively keep it compatible withanything but the current version of ‘ggplot2’, although it willfrequently also work with some earlier versions. Please, see the blogpostPlayingon the same team as your dependecy by Thomas Lin Pedersen.
To my surprise, and thanks to the care taken by the developers of‘ggplot2’, in spite of the overhaul of the class system in ‘ggplot2’ (==4.0.0), no changes were necessary to keep ‘gginnards’ compatible withthe updated ‘ggplot2’! A huge thanks you to Teun van den Brand, ThomasLin Pedersen and the rest of the ‘ggplot2’ team.
The debug statistics and geoms are defined in ‘gginnards’ using thesame approach as other ‘ggplot2’ extensions, without any significantassumptions about the internals of ‘ggplot2’. Thus, they have not beenaffected by minor, and even major, updates to ‘ggplot2’. The layermanipulation functions rely on the internal structure of"gg" objects, but mostly on aspects unlikely to changefrequently.
Package ‘gginnards’ does not provide a deep view into the structureofggplot objects or the steps involved in building theseobjects and rendering them into graphical objects. Package‘ggtrace’ by June Choeprovides tools for a much deeper and detailed exploration and edition ofggplots, but it is much more dependent on the undocumented internals of‘ggplot2’ than ‘gginnards’. (Note: there exists another package namedggtrace for a differentpurpose, available through CRAN.)
This package was born when several functions were extracted frompackage ‘ggpmisc’ and packaged on their own.
Geometriesgeom_debug_panel() andgeom_debug_group() by default print thedataobject received as input by the draw function to the console adding aplot layer that produces no graphic output. As they take as argumentssummary functions, they allows flexibility in howdataobjects are displayed.geom_debug_panel() andgeom_debug_group() are useful at any time when one needs tocheck what variables are returned by statistics. Many statistics arewell documented and always return the same variables. For otherstatistics even if well documented the returned variables indata vary depending on grouping and/or the arguments passedto them, in which case this geometry can also be useful for debuggingdata-visualization scripts.
Statisticsstat_debug_panel() andstat_debug_group(), which echo their data input to the Rconsole, aim at easing debugging during development of new geoms andstatistics. They will also help those learning how ggplot grouping,panels and layers work. As thedebug geometries, they take asarguments summary functions allowing flexibility in howdata objects are displayed.
For debugging, the value returned by these stats is usually notinteresting, and by default, it is a copy of thedataobject received as input. This can be changed by passing a function asargument tofun.data. This could be useful to produce datasummaries to be plotted as a layer. This may even work as a tool usefulto build ad-hoc statistics with rudimentary built-in debugging.
A set of functions easy the manipulation of layers in ggplot objects,allowing deletion of any existing layer, insertion of new layers at anyposition, and reordering of the existing layers.
A function to drop unused variables from the data object embedded inggplot objects serves as an additional example of amanipulation that may be useful when dealing with very large datasets.Companion functions are defined to explore the embeddeddata object.
library(gginnards)#> Loading required package: ggplot2We print to the R consoledata asseen as inputby geometries and statistics.
ggplot(mtcars,aes(cyl, mpg,color = mpg))+geom_point()+geom_debug_panel()
#> [1] "PANEL 1; group(s) -1; 'draw_panel()' input 'data' (head):"#> x y colour PANEL group#> 1 6 21.0 #30648F 1 -1#> 2 6 21.0 #30648F 1 -1#> 3 4 22.8 #356E9D 1 -1#> 4 6 21.4 #316692 1 -1#> 5 8 18.7 #29577E 1 -1#> 6 6 18.1 #275379 1 -1#> [1] "PANEL 1; group(s) -1; 'draw_panel()' input 'params' (summary):"#> Length Class Mode #> x 11 ViewScale environment#> x.sec 11 ViewScale environment#> x.range 2 -none- numeric #> y 11 ViewScale environment#> y.sec 11 ViewScale environment#> y.range 2 -none- numeric #> reverse 1 -none- character #> guides 4 Guides environmentWe print to the R consolecolnames(data).
ggplot(mtcars,aes(cyl, mpg,color = mpg))+geom_point()+geom_debug_panel(dbgfun.data = colnames,dbgfun.params =NULL)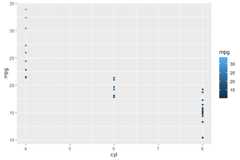
#> [1] "PANEL 1; group(s) -1; 'draw_panel()' input 'data' (anonymous function):"#> [1] "x" "y" "colour" "PANEL" "group"We print to the R consoledata as returned bystat_summary() andseen as input bygeometries.
ggplot(mtcars,aes(cyl, mpg,colour =factor(cyl)))+stat_summary(fun.data ="mean_cl_boot")+stat_summary(fun.data ="mean_cl_boot",geom ="debug_panel")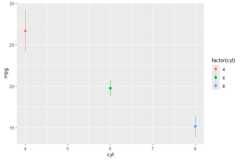
#> [1] "PANEL 1; group(s) 1, 2, 3; 'draw_function()' input 'data' (head):"#> x group y ymin ymax colour PANEL flipped_aes orientation#> 1 4 1 26.66364 24.16364 29.29159 #F8766D 1 FALSE NA#> 2 6 2 19.74286 18.80000 20.74286 #00BA38 1 FALSE NA#> 3 8 3 15.10000 13.77839 16.42143 #619CFF 1 FALSE NAWe print to the R consoledata asseen as inputby statistics that use apanel function.
ggplot(mtcars,aes(cyl, mpg,colour =factor(cyl)))+stat_debug_panel()
#> [1] "PANEL 1; group(s) 1, 2, 3; 'compute_panel()' input 'data' (head):"#> x y colour PANEL group#> 1 6 21.0 6 1 2#> 2 6 21.0 6 1 2#> 3 4 22.8 4 1 1#> 4 6 21.4 6 1 2#> 5 8 18.7 8 1 3#> 6 6 18.1 6 1 2We build aggplot objectp. We query the numberof layers and the position of layers by the class of theggproto object.
p<-ggplot(mtcars,aes(cyl, mpg))+geom_point(size =3)+stat_summary(fun.data ="mean_cl_boot",color ="red",size =2)num_layers(p)#> [1] 2which_layers(p,"GeomPoint")#> geom_point#> 1which_layers(p,"StatSummary")#> stat_summary#> 2 p
move_layers(p,"GeomPoint",position ="top")
Installation of the most recent stable version from CRAN (sources,Mac and Win binaries):
install.packages("gginnards")Installation of the current unstable version from R-UniverseCRAN-like repository (binaries for Mac, Win, Webassembly, and Linux, aswell as sources available):
install.packages('gginnards',repos =c('https://aphalo.r-universe.dev','https://cloud.r-project.org'))Installation of the current unstable version from GitHub (fromsources):
# install.packages("devtools")devtools::install_github("aphalo/gginnards")HTML documentation is available at (https://docs.r4photobiology.info/gginnards/), includingtwo vignettes.
News about major updates are posted at (https://www.r4photobiology.info/).
Please report bugs and request new features at (https://github.com/aphalo/gginnards/issues). Pullrequests are welcome at (https://github.com/aphalo/gginnards).
If you use this package to produce scientific or commercialpublications, please cite according to:
citation("gginnards")#> To cite package 'gginnards' in publications use:#>#> Aphalo P (2025). _gginnards: Explore the Innards of 'ggplot2'#> Objects_. R package version 0.2.0-2,#> <https://docs.r4photobiology.info/gginnards/>.#>#> A BibTeX entry for LaTeX users is#>#> @Manual{,#> title = {gginnards: Explore the Innards of 'ggplot2' Objects},#> author = {Pedro J. Aphalo},#> year = {2025},#> note = {R package version 0.2.0-2},#> url = {https://docs.r4photobiology.info/gginnards/},#> }© 2016-2025 Pedro J. Aphalo(pedro.aphalo@helsinki.fi).Released under the GPL, version 2 or greater. This software carries nowarranty of any kind.