

raem is an R package for modeling steady-state,single-layer groundwater flow under the Dupuit-Forchheimer assumptionusing analytic elements.
To install the released version:
install.packages("raem")The development version ofraem can be installed fromGitHub with:
# install.packages("devtools")devtools::install_github("cneyens/raem")The package documentation can be found athttps://cneyens.github.io/raem/.
Construct an analytic element model of an aquifer with uniformbackground flow, two extraction wells and a reference point.
Specify the aquifer parameters and create the elements:
library(raem)# aquifer parameters ----k=10# hydraulic conductivity, m/dtop=10# aquifer top elevation, mbase=0# aquifer bottom elevation, mn=0.2# aquifer porosity, -hr=15# head at reference point, mTR= k* (top- base)# constant transmissivity of background flow, m^2/d# create elements ----uf=uniformflow(TR,gradient =0.001,angle =-45)rf=constant(xc =-1000,yc =0,hc = hr)w1=well(xw =200,yw =0,Q =250)w2=well(xw =-200,yw =-150,Q =400)Create the model. This automatically solves the system ofequations.
m=aem(k = k,top = top,base = base,n = n, uf, rf, w1, w2)Find the head and discharge at two locations:x = -200, y = 200 andx = 100, y = 200. Notethat there are no vertical flow components in this model:
heads(m,x =c(-200,100),y =200)#> [1] 13.64573 13.33314discharge(m,c(-200,100),200,z = top)# m^2/d#> Qx Qy Qz#> [1,] 0.15028815 -0.2923908 0#> [2,] 0.06041242 -0.3347206 0Plot the head contours and element locations. First, specify thecontouring grid:
xg=seq(-500,500,length =100)yg=seq(-250,250,length =100)Now plot:
contours(m, xg, yg,'heads',col ='dodgerblue',nlevels =20)plot(m,add =TRUE)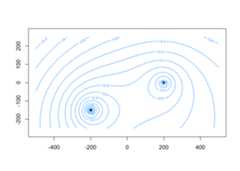
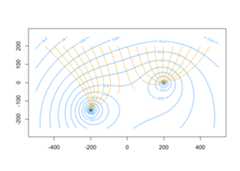
Compute particle traces starting alongy = 200 at 20intervals per year for 5 years and add to the plot:
paths=tracelines(m,x0 =seq(-450,450,50),y0 =200,z0 = top,times =seq(0,5*365,365/20))plot(paths,add =TRUE,col ='orange')