
The goal ofsugrrants is to provide supporting graphs with Rfor analysing time series data. It aims to fit into thetidyverse and grammar of graphics framework for handlingtemporal data.
You could install the stable version on CRAN:
install.packages("sugrrants")You could also install the development version from Github using:
# install.packages("remotes")remotes::install_github("earowang/sugrrants")The fully-fledged faceting calendarfacet_calendar()unlocks day-to-day stories.
library(dplyr)library(sugrrants)hourly_peds%>%filter(Date<as.Date("2016-05-01"))%>%ggplot(aes(x = Time,y = Hourly_Counts,colour = Sensor_Name))+geom_line()+facet_calendar(~ Date)+# a variable contains datestheme_bw()+theme(legend.position ="bottom")
On the other hand, theframe_calendar() provides toolsfor re-structuring the data into a compact calendar layout, withoutusing the faceting method. It is fast and light-weight, although it doesnot preserve the values.
p<- hourly_peds%>%filter(Sensor_ID==9, Year==2016)%>%mutate(Weekend =if_else(Day%in%c("Saturday","Sunday"),"Weekend","Weekday"))%>%frame_calendar(x = Time,y = Hourly_Counts,date = Date)%>%ggplot(aes(x = .Time,y = .Hourly_Counts,group = Date,colour = Weekend))+geom_line()+theme(legend.position ="bottom")prettify(p)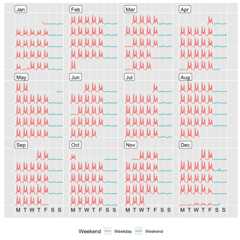
This package is part of the project—Tidydata structures and visual methods to support exploration of bigtemporal-context data, which has been participated in Google Summerof Code 2017 (gsoc), forR projectfor statistical computing.
A new functionframe_calendar() [hereandhere]in thesugrrants package has been developed anddocumented for calendar-based graphics. I have also written a vignette[sourceandreaderview], which introduces and demonstrates the usage of theframe_calendar() function.Manyunit tests have been carried out to ensure the expected performanceof this function. The function implements non-standard evaluation andhighlights thetidy evaluation inaction. The initial release (v0.1.0) of the package has been publishedonCRANduring the gsoc summer time.
I have initialised a new R packagetsibblefor tidy temporal data, as part of the project. Thetsibble() function constructs a newtbl_tsclass for temporal data, and theas_tsibble() helps toconvert a fewts objects into thetbl_tsclass. Some key verbs (generics) from thedplyrpackage, such asmutate(),summarise(),filter(), have been defined and developed for thetbl_ts data class. Thetsibble package washighly experimental over the period of the gsoc [commits],and these functions are very likely to be changed or improved in thefuture.
walk_melb()andshine_melb(),have been written and documented as the v0.1.0 and v0.2.0 releases onCRAN. The majority of the code for the functionrun_melb()has been done, but the interface needs improving after the gsoc.The acronym ofsugrrants isSUpportingGRaphs withR forANalysingTimeSeries, pronounced as “sugar ants” that are a speciesof ant endemic to Australia.
Please note that this project is released with aContributorCode of Conduct. By participating in this project you agree to abideby its terms.