| Title: | Applies Display Metadata to Analysis Results Datasets |
| Version: | 0.2.1 |
| Description: | Creates a framework to store and apply display metadata to Analysis Results Datasets (ARDs). The use of 'tfrmt' allows users to define table format and styling without the data, and later apply the format to the data. |
| License: | Apache License (≥ 2) |
| URL: | https://GSK-Biostatistics.github.io/tfrmt/,https://github.com/GSK-Biostatistics/tfrmt |
| BugReports: | https://github.com/GSK-Biostatistics/tfrmt/issues |
| Depends: | R (≥ 4.2.0) |
| Imports: | cli, dplyr, forcats, ggplot2, glue, gt (≥ 0.6.0), jsonlite,magrittr, purrr, rlang, stringi, stringr, tibble, tidyr,tidyselect |
| Suggests: | cards (≥ 0.6.0), covr, ggfortify, knitr, patchwork,pharmaverseadam, rmarkdown, survival, testthat (≥ 3.0.0),withr |
| Config/testthat/edition: | 3 |
| Encoding: | UTF-8 |
| Language: | en-GB |
| LazyData: | true |
| RoxygenNote: | 7.3.3 |
| NeedsCompilation: | no |
| Packaged: | 2025-10-03 21:15:57 UTC; bkrouse |
| Author: | Becca Krouse [aut, cre], Christina Fillmore [aut], Ellis Hughes [aut], Karima Ahmad [aut], Shannon Haughton [aut], Dragoș Moldovan-Grünfeld [aut], GlaxoSmithKline Research & Development Limited [cph, fnd], Atorus Research LLC [cph, fnd] [aut], Ellis Hughes [aut], Karima Ahmad [aut], Shannon Haughton [aut], Dragoș Moldovan-Grünfeld [aut], GlaxoSmithKline Research & Development Limited [cph, fnd], Atorus Research LLC [cph, fnd] |
| Maintainer: | Becca Krouse <becca.z.krouse@gsk.com> |
| Repository: | CRAN |
| Date/Publication: | 2025-10-04 05:10:03 UTC |
Pipe operator
Description
Seemagrittr::%>% for details.
Usage
lhs %>% rhsArguments
lhs | A value or the magrittr placeholder. |
rhs | A function call using the magrittr semantics. |
Value
The result of callingrhs(lhs).
Apply formatting
Description
Apply formatting
Usage
apply_frmt(frmt_def, .data, value, mock = FALSE, ...)## S3 method for class 'frmt'apply_frmt(frmt_def, .data, value, mock = FALSE, ...)## S3 method for class 'frmt_combine'apply_frmt( frmt_def, .data, value, mock = FALSE, param, column, label, group, ...)## S3 method for class 'frmt_when'apply_frmt(frmt_def, .data, value, mock = FALSE, ...)Arguments
frmt_def | formatting to be applied |
.data | data, but only what is getting changed |
value | value symbol should only be one |
mock | Logical value is this is for a mock or not. By default |
... | additional arguments for methods |
param | param column as a quosure |
column | column columns as a list of quosures |
label | label column as a quosure |
group | group column as a list of quosures |
Value
formatted dataset
Examples
library(tibble)library(dplyr)# Set up datadf <- tibble(x = c(20.12,34.54,12.34))apply_frmt( frmt_def = frmt("XX.X"), .data=df, value=quo(x))Convert tfrmt elements
Description
This collection of functions is used to create a json or json ready objects.While primarily intended for internal use these functions can be used externally
Usage
as_json(x)Arguments
x | tfrmt or tfrmt element |
Value
as_json.tfrmt() will return a json object all other methods willreturn a list that is cleaned so it can be directly converted to a jsonobject
Big N Structure
Description
Big N structure allows you to specify which values should become the subjecttotals ("big N" values) and how they should be formatted in the table'scolumn labels. Values are specified by providing the value(s) of theparamcolumn for which the values are big N's. This will remove these from thebody of the table and place them into columns matching the values in thecolumn column(s). The default formatting isN = xx, on its own line, butthat can be changed by providing a differentfrmt() ton_frmt.
Usage
big_n_structure(param_val, n_frmt = frmt("\nN = xx"), by_page = FALSE)Arguments
param_val | row value(s) of the parameter column for which the valuesare big N's |
n_frmt |
|
by_page | Option to include different big N's for each group-defined setof pages (defined by any variables set to |
Value
big_n_structure object
See Also
Table Body Plan
Description
Define the formatting of the body contents of the table through a series offrmt_structures. Structures get applied in order from bottom up, so the lastadded structure is the first applied.
Usage
body_plan(...)Arguments
... | list of frmt_structures defining the body formatting |
Value
body_plan object
See Also
frmt_structure() defines which rows the formats will be appliedto, andfrmt(),frmt_combine(), andfrmt_when() define the formatsemantics.
Examples
tfrmt_spec<- tfrmt( title = "Table Title", body_plan = body_plan( frmt_structure( group_val = c("group1"), label_val = ".default", frmt("XXX") ) ) )Do all the formatting for the GT
Description
Do all the formatting for the GT
Apply formatting to a list of tables
Apply formatting to a single table
Usage
cleaned_data_to_gt(.data, tfrmt, .unicode_ws)## S3 method for class 'list'cleaned_data_to_gt(.data, tfrmt, .unicode_ws)## Default S3 method:cleaned_data_to_gt(.data, tfrmt, .unicode_ws)Arguments
.data | cleaned dataset |
tfrmt | tfrmt |
.unicode_ws | Whether to convert white space to unicode in preparation for output |
Value
gt_group object
GT object
Define the Column Plan & Span Structures
Description
Using <tidy-select> expressions and a seriesspan_structures, define the order of the columns. The selection follows "lastselected" principals, meaning columns are moved to thelast selection asopposed to preserving the first location.
Usage
col_plan(..., .drop = FALSE)span_structure(...)Arguments
... | For a col_plan and span_structure,< |
.drop | Boolean. Should un-listed columns be dropped from the data.Defaults to FALSE. |
Details
Column Selection
When col_plan gets applied and is used to create the output table, theunderlying logic sorts out which column specifically is being selected. If a columnis selected twice, thelast instance in which the column is selected will bethe location it gets rendered.
Avoid beginning thecol_plan() column selection with a deselection (i.e.col_plan(-col1),col_plan(-starts_with("value"))). This willresult in the table preserving all columns not "de-selected" in thestatement, and the order of the columns not changed. It is preferred whencreating thecol_plan() to identify all the columns planned onpreserving in the order they are wished to appear, or if<tidy-select> arguments - such aseverything- are used, identify the de-selection afterthe positive-selection.
Alternatively, once the gt table is produced, use thecols_hide function to remove un-wanted columns.
Value
col_plan object
span_structure object
Images
Here are some example outputs:
See Also
Examples
library(dplyr)## select col_1 as the first column, remove col_last, then create spanning## structures that have multiple levels#### examples also assume the tfrmt has the column argument set to c(c1, c2, c3)##spanning_col_plan_ex <- col_plan( col_1, -col_last, span_structure( c1 = "Top Label Level 1", c2 = "Second Label Level 1.1", c3 = c(col_3, col_4) ), span_structure( c1 = "Top Label Level 1", c2 = "Second Label Level 1.2", c3 = starts_with("B") ), span_structure( c1 = "Top Label Level 1", c3 = col_5 ), span_structure( c2 = "Top Label Level 2", c3 = c(col_6, col_7) ))## select my_col_1 as the first column, then## rename col_2 to new_col_1 and put as the## second column, then select the rest of the columnsrenaming_col_plan_ex <- col_plan( my_col_1, new_col_1 = col_2, everything() )renaming_col_plan_ex2 <- col_plan( my_col_1, new_col_1 = col_2, span_structure( c1 = c(`My Favorite span name` = "Top Label Level 1"), c3 = c(`the results column` = col_5) ) )Column Style Plan
Description
Define how the columns of the table body should be aligned, whether left,right or on a specific character(s).
Usage
col_style_plan(...)Arguments
... | series of col_style_structure objects |
Value
col_style_plan object
See Also
col_style_structure() for more information on how to specify how to and which columns to align.
Examples
plan <- col_style_plan( col_style_structure(col = "my_var", align = "left", width = 100), col_style_structure(col = vars(four), align = "right"), col_style_structure(col = vars(two, three), align = c(".", ",", " ")) )Column Style Structure
Description
Column Style Structure
Usage
col_style_structure( col, align = NULL, type = c("char", "pos"), width = NULL, ...)Arguments
col | Column value to align on from |
align | Alignment to be applied to column. Defaults to |
type | Type of alignment: "char" or "pos", for character alignment (default), and positional alignment, respectively. Positional alignment allows for aligning over multiple positions in the column. |
width | Width to apply to the column in number of characters. Acceptable values include anumeric value, or a character string of a number. |
... | These dots are for future extensions and must be empty |
Details
Supports alignment and width setting of data value columns (values found in thecolumn column). Row group and label columns are left-aligned by default. Acceptable input values foralign differ by type = "char" or "pos":
Character alignment (type = "char"):
"left" for left alignment
"right" for right alignment"
supply a vector of character(s) to align on. If more thanone character is provided, alignment will be based on the first occurrenceof any of the characters. For alignment based on white space, leading whitespaces will be ignored.
Positional alignment (type = "pos"):
supply a vector of strings covering all formatted cell values, with numeric values represented as x's. These values can be created manually or obtained by utilizing the helperdisplay_val_frmts(). Alignment positions will be represented by vertical bars. For example, with starting values: c("12.3", "(5%)", "2.35 (10.23)") we can align all of the first sets of decimals and parentheses by providing align = c("xx|.x", "||(x%)", "x|.xx |")
Value
col_style_structure object
See Also
col_style_plan() for more information on how to combinecol_style_structure()'s together to form a plan.
Examples
plan <- col_style_plan( col_style_structure(col = "my_var", align = c("xx| |(xx%)", "xx|.x |(xx.x - xx.x)"), type = "pos", width = 100), col_style_structure(col = vars(four), align = "right", width = 200), col_style_structure(col = vars(two, three), align = c(".", ",", " ")), col_style_structure(col = c(two, three), width = 25), col_style_structure(col = two, width = 25), col_style_structure(col = span_structure(span = value, col = val2), width = 25) )Adverse Events Analysis Results Data
Description
A dataset containing the results needed for an AE table. Using theCDISC pilot data.
Usage
data_aeFormat
A data frame with 2,794 rows and 8 variables:
- AEBODSYS
highest level row labels: System Organ Class
- AETERM
more specific row labels: Preferred Term
- col2
higher level column names (spanners)
- col1
lower level column names
- param
parameter to explain each value
- value
values to put in a table
- ord1
controls ordering
- ord2
more ordering controls
Demography Analysis Results Data
Description
A dataset containing the results needed for a demography table. Using theCDISC pilot data.
Usage
data_demogFormat
A data frame with 386 rows and 7 variables:
- rowlbl1
highest level row labels
- rowlbl2
more specific row labels
- param
parameter to explain each value
- grp
grouping column used to distinguish continuous and categorical
- ord1
controls ordering
- ord2
more ordering controls
- column
column names
- value
values to put in a table
Efficacy Analysis Results Data
Description
A dataset containing the results needed for an Efficacy table. Using theCDISC pilot data for ADAS-Cog(11).
Usage
data_efficacyFormat
A data frame with 70 rows and 7 variables:
- group
highest level row labels
- label
more specific row labels
- column
column names
- param
parameter to explain each value
- value
values to put in a table
- ord1
controls ordering
- ord2
more ordering controls
Labs Analysis Results Data
Description
A dataset containing the results needed for an labs results table. Using theCDISC pilot data.
Usage
data_labsFormat
A data frame with 4,950 rows and 7 variables:
- group1
highest level row labels: Lab value class
- group2
more specific row labels: Lab parameter
- rowlbl
most specific row labels: Study visit
- col1
higher level column names (spanners)
- col2
lower level column names
- param
parameter to explain each value
- value
values to put in a table
- ord1
controls ordering
- ord2
more ordering controls
- ord3
more ordering controls
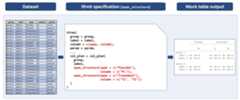
Display formatting applied to each row
Description
Used when debugging formatting, it is an easy way to allow you to see whichformats are applied to each row in your dataset.
Usage
display_row_frmts(tfrmt, .data, convert_to_txt = TRUE)Arguments
tfrmt | tfrmt object to apply to the data |
.data | Data to apply the tfrmt to |
convert_to_txt | Logical value converting formatting to text, by default |
Value
formatted tibble
Examples
library(dplyr) library(tidyr) tfrmt_spec <- tfrmt( label = label, column = column, param = param, value=value, body_plan = body_plan( frmt_structure(group_val = ".default", label_val = ".default", frmt_combine( "{count} {percent}", count = frmt("xxx"), percent = frmt_when("==100"~ frmt(""), "==0"~ "", "TRUE" ~ frmt("(xx.x%)")))) )) # Create data df <- crossing(label = c("label 1", "label 2"), column = c("placebo", "trt1"), param = c("count", "percent")) %>% mutate(value=c(24,19,2400/48,1900/38,5,1,500/48,100/38)) display_row_frmts(tfrmt_spec,df)Display formatted values
Description
A helper for creating positional-alignment specifications for the col_style_plan.Returns all unique formatted values to appear in the column(s) specified. Numeric values are represented by x's.
Usage
display_val_frmts(tfrmt, .data, mock = FALSE, col = NULL)Arguments
tfrmt | tfrmt object to apply to the data |
.data | Data to apply the tfrmt to |
mock | Mock table? TRUE or FALSE (default) |
col | Column value to align on from |
Value
text representing character vector of formatted values to be copied and modified in the col_style_plan
Examples
tf_spec <- tfrmt( group = c(rowlbl1,grp), label = rowlbl2, column = column, param = param, value = value, sorting_cols = c(ord1, ord2), body_plan = body_plan( frmt_structure(group_val = ".default", label_val = ".default", frmt_combine("{n} ({pct} %)", n = frmt("xxx"), pct = frmt("xx.x"))), frmt_structure(group_val = ".default", label_val = "n", frmt("xxx")), frmt_structure(group_val = ".default", label_val = c("Mean", "Median", "Min","Max"), frmt("xxx.x")), frmt_structure(group_val = ".default", label_val = "SD", frmt("xxx.xx")), frmt_structure(group_val = ".default", label_val = ".default", p = frmt_when(">0.99" ~ ">0.99", "<0.15" ~ "<0.15", TRUE ~ frmt("x.xxx", missing = ""))))) display_val_frmts(tf_spec, data_demog, col = vars(everything())) display_val_frmts(tf_spec, data_demog, col = "p-value")Element block
Description
Element block
Usage
element_block(post_space = c(NULL, " ", "-"), fill = TRUE)Arguments
post_space | Values to show in a new line created after the group block |
fill | Whether to recycle the value of |
Value
element block object
See Also
row_grp_plan() for more details on how to group row groupstructures,row_grp_structure() for more details on how to specify row groupstructures,element_row_grp_loc() for more details on how tospecify whether row group titles span the entire table or collapse.
Examples
tfrmt_spec <- tfrmt( group = grp1, label = label, param = param, value = value, column = column, row_grp_plan = row_grp_plan( row_grp_structure(group_val = ".default", element_block(post_space = " ")) ), body_plan = body_plan( frmt_structure(group_val = ".default", label_val = ".default", frmt("xx")) ))Element Row Group Location
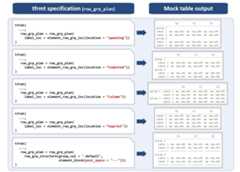
Description
Element Row Group Location
Usage
element_row_grp_loc( location = c("indented", "spanning", "column", "noprint", "gtdefault"), indent = " ")Arguments
location | Location of the row group labels. Specifying 'indented'combines all group and label variables into a single column with eachsub-group indented under its parent. 'spanning' and 'column' retain thehighest level group variable in its own column and combine all remaininggroup and label variables into a single column with sub-groups indented. Thehighest level group column will either be printed as a spanning header or inits own column in the gt. The 'noprint' option allows the user to suppressgroup values from being printed. Finally, the 'gtdefault' option allowsusers to use the 'gt' defaults for styling multiple group columns. |
indent | A string of the number of spaces you want to indent |
Value
element_row_grp_loc object
Images
Here are some example outputs:
See Also
row_grp_plan() for more details on how to group row groupstructures,row_grp_structure() for more details on how to specify rowgroup structures,element_block() for more details on how to specifyspacing between each group.
Examples
tfrmt_spec <- tfrmt( group = c(grp1, grp2), label = label, param = param, value = value, column = column, row_grp_plan = row_grp_plan(label_loc = element_row_grp_loc(location = "noprint")), body_plan = body_plan( frmt_structure(group_val = ".default", label_val = ".default", frmt("xx")) ))Footnote Plan
Description
Defining the location and content of footnotes with a series of footnotestructures. Each structure is a footnote and can be applied in multiple locations.
Usage
footnote_plan(..., marks = c("numbers", "letters", "standard", "extended"))Arguments
... | a series of |
marks | type of marks required for footnotes, properties inherited fromtab_footnote in 'gt'. Available options are "numbers", "letters","standard" and "extended" (standard for a traditional set of 4 symbols,extended for 6 symbols). The default option is set to "numbers". |
Value
footnote plan object
Examples
# Adds a footnote indicated by letters rather than numbers to Group 1footnote_plan <- footnote_plan( footnote_structure(footnote_text = "Source Note", group_val = "Group 1"), marks="letters")# Adds a footnote to the 'Placebo' columnfootnote_plan <- footnote_plan( footnote_structure(footnote_text = "footnote", column_val = "Placebo"), marks="numbers")Footnote Structure
Description
Footnote Structure
Usage
footnote_structure( footnote_text, column_val = NULL, group_val = NULL, label_val = NULL)Arguments
footnote_text | string with text for footnote |
column_val | string or a named list of strings which represent the column to apply the footnote to |
group_val | string or a named list of strings which represent the value of group to apply the footnote to |
label_val | string which represents the value of label to apply the footnote to |
Value
footnote structure object
Examples
# Adds a source note aka a footnote without a symbol in the tablefootnote_structure <- footnote_structure(footnote_text = "Source Note")# Adds a footnote to the 'Placebo' columnfootnote_structure <- footnote_structure(footnote_text = "Text", column_val = "Placebo")# Adds a footnote to either 'Placebo' or 'Treatment groups' depending on which# which is last to appear in the column vectorfootnote_structure <- footnote_structure(footnote_text = "Text", column_val = list(col1 = "Placebo", col2= "Treatment groups"))# Adds a footnote to the 'Adverse Event' labelfootnote_structure <- footnote_structure("Text", label_val = "Adverse Event")Table Value Formatting
Description
These functions provide an abstracted way to approach to define formatting of tablecontents. By defining in this way, the formats can belayered to be more specific and general cell styling can be done first.
frmt() is the base definition of a format. This defines spacing, rounding,and missing behaviour.
frmt_combine() is used when two or more rows need to be combined into asingle cell in the table. Each of the rows needs to have a definedfrmt()and need to share a label.
frmt_when() is used when a rows format behaviour is dependent on the value itself and is written similarly todplyr::case_when().The left hand side of the equation is a"TRUE"for the default case or the right hand side of a boolean expression">50".
Usage
frmt(expression, missing = NULL, scientific = NULL, transform = NULL, ...)frmt_combine(expression, ..., missing = NULL)frmt_when(..., missing = NULL)Arguments
expression | this is the string representing the intended format. See details: expression for more a detailed description. |
missing | when a value is missing that is intended to be formatted, what value to place. See details: missing for more a detailed description. |
scientific | a string representing the intended scientific notation to be appended to the expression. Ex. "e^XX" or " x10^XX". |
transform | this is what should happen to the value prior to formatting,It should be a formula or function. Ex. |
... | See details: |
Details
expression
frmt()All numbers are represented by "x". Any additional character areprinted as-is. If additional X's present to the left of the decimal pointthan the value, they will be represented as spaces.frmt_combine()defines how the parameters will be combined as aglue::glue()statement. Parameters need to be equal to the values in theparam column and defined in the expression as"{param1} {param2}".
missing
frmt()Value to enter when the value is missing. When NULL, the valueis "".frmt_combine()defines how when all values to be combined are missing.When NULL the value is "".
...
frmt()These dots are for future extensions and must beempty.frmt_combine()accepts named arguments defining thefrmt()tobe applied to which parameters before being combined.frmt_when()accepts a series of equations separated by commas, similartodplyr::case_when(). The left hand side of the equation is a"TRUE"for thedefault case or the right hand side of a boolean expression">50". Theright hand side of the equation is thefrmt()to apply when the leftside evaluates toTRUE.
Value
frmt object
See Also
body_plan() combines the frmt_structures to be applied to thetable body, andfrmt_structure() defines which rows the formats will be appliedto.
Examples
frmt("XXX %")frmt("XX.XXX")frmt("xx.xx", scientific = "x10^xx")frmt_combine( "{param1} {param2}", param1 = frmt("XXX %"), param2 = frmt("XX.XXX"))frmt_when( ">3" ~ frmt("(X.X%)"), "<=3" ~ frmt("Undetectable") )frmt_when( "==100"~ frmt(""), "==0"~ "", "TRUE" ~ frmt("(XXX.X%)") )Format Structure Object
Description
Function needed to create a frmt_structure object, which is a building blockofbody_plan(). This specifies the rows the format will be applied to.
Usage
frmt_structure(group_val = ".default", label_val = ".default", ...)Arguments
group_val | A string or a named list of strings which represent thevalue of group should be when the given frmt is implemented |
label_val | A string which represent the value of label should be whenthe given frmt is implemented |
... | either a |
Value
frmt_structure object
Images
Here are some example outputs:
See Also
body_plan() combines the frmt_structures to be applied to thetable body, andfrmt(),frmt_combine(), andfrmt_when() define theformat semantics.
Examples
sample_structure <- frmt_structure( group_val = c("group1"), label_val = ".default", frmt("XXX") )## multiple group columnssample_structure <- frmt_structure( group_val = list(grp_col1 = "group1", grp_col2 = "subgroup3"), label_val = ".default", frmt("XXX") )Check if input is a frmt
Description
Check if input is a frmt
Check if input is a frmt_combine
Check if input is a frmt_when
Check if input is a frmt_structure
Check if input is a row_grp_structure
Usage
is_frmt(x)is_frmt_combine(x)is_frmt_when(x)is_frmt_structure(x)is_row_grp_structure(x)Arguments
x | Object to check |
Value
'TRUE' if yes, 'FALSE' if no
Examples
x1 <- frmt("XXX.XX")is_frmt(x1)x2 <- frmt_combine("XXX %","XX,XXX")is_frmt_combine(x2)x2 <- frmt_when(">3" ~ frmt("(X.X%)"),"<=3" ~ frmt("Undetectable"))is_frmt_when(x2)x3 <- frmt_structure( group_val = c("group1"), label_val = ".default",frmt("XXX"))is_frmt_structure(x3)x4 <- row_grp_structure(group_val = c("A","C"), element_block(post_space = "---"))is_row_grp_structure(x4)json to tfrmt
Description
Reader to read JSON files/objects into tfrmt objects
Usage
json_to_tfrmt(path = NULL, json = NULL)Arguments
path | location of the json file to read in |
json | json object to read in. By default this is null. This functionwill read in json object preferentially. So if both a path and a jsonobject are supplied the json object will be read in. |
Layer tfrmt objects together
Description
Provide utility for layering tfrmt objects together. If both tfrmt's havevalues, it will preferentially choose the second tfrmt by default. This is analternative to piping together tfrmt's
Usage
layer_tfrmt(x, y, ..., join_body_plans = TRUE)Arguments
x,y | tfrmt objects that need to be combined |
... | arguments passed to layer_tfrmt_arg functions for combining different tfrmt elements |
join_body_plans | should the |
Details
join_body_plan
When combining two body_plans, the body plans will stack together, first thebody plan from x tfrmt then y tfrmt. This means that frmt_structures in ywill take priority over those in x.
Combining two tfrmt with large body_plans can lead to slow table evaluation.Consider settingjoin_body_plan toFALSE. Only the ybody_plan will bepreserved.
Value
tfrmt object
Examples
tfrmt_1 <- tfrmt(title = "title1")tfrmt_2 <- tfrmt(title = "title2",subtitle = "subtitle2")layered_table_format <- layer_tfrmt(tfrmt_1, tfrmt_2)Make mock data for display shells
Description
Make mock data for display shells
Usage
make_mock_data(tfrmt, .default = 1:3, n_cols = NULL)Arguments
tfrmt | tfrmt object |
.default | Number of unique levels to create for group/label values setto ".default" |
n_cols | Number of columns in the output table (not includinggroup/label variables). If not supplied it will default to using the |
Value
tibble containing mock data
Examples
tfrmt_spec <- tfrmt( label = label, column = column, param = param, value=value, body_plan = body_plan( frmt_structure(group_val=".default", label_val=".default", frmt("xx.x")) ) )make_mock_data(tfrmt_spec)Page Plan
Description
Defining the location and/or frequency of page splits with a series ofpage_structure's and the row_every_n argument, respectively.
Usage
page_plan( ..., note_loc = c("noprint", "preheader", "subtitle", "source_note"), max_rows = NULL)Arguments
... | a series of |
note_loc | Location of the note describing each table's subset value(s).Useful if the |
max_rows | Option to set a maximum number of rows per page. Takes a numeric value. |
Value
page_plan object
Examples
# use of page_struct page_plan( page_structure(group_val = "grp1", label_val = "lbl1") ) # use of # rows page_plan( max_rows = 5 )Page structure
Description
Page structure
Usage
page_structure(group_val = NULL, label_val = NULL)Arguments
group_val | string or a named list of strings which represent the value of group to split after.Set to ".default" if the split should occur after every unique value of the variable. |
label_val | string which represents the value of label to split after.Set to ".default" if the split should occur after every unique value ofthe variable. |
Value
page structure object
Examples
# split page after every unique level of the grouping variable page_structure(group_val = ".default", label_val = NULL) # split page after specific levels page_structure(group_val = "grp1", label_val = "lbl3")Set custom parameter-level significant digits rounding
Description
Set custom parameter-level significant digits rounding
Usage
param_set(...)Arguments
... | Series of name-value pairs, optionally formatted using |
Details
Typeparam_set() in console to view package defaults. Use of thefunction will add to the defaults and/or override included defaults of thesame name. For values that are integers, useNA so no decimal places willbe added.
Value
list of default parameter-level significant digits rounding
Examples
# View included defaultsparam_set()# Update the defaultsparam_set("{mean} ({sd})" = c(2,3), "pct" = 1)# Separate mean and SD to different linesparam_set("mean" = 2, "sd" = 3)# Add formatting using the glue syntaxparam_set("{pct} %" = 1)PreparebigN stat variables
Description
![[Experimental]](/image.pl?url=http%3a%2f%2fcran.rstudio.com%2fweb%2fpackages%2frmarkdown%2f..%2frgtmx%2f..%2fjsonlite%2f..%2ftfrmt%2frefman%2f.%2ffigures%2flifecycle-experimental.svg&f=jpg&w=240)
prep_big_n():
recodes the
"n"stat_nameintobigNfor the desired variables,anddrops all other
stat_namesfor the same variables.
If yourtfrmt contains abig_n_structure() you pass the tfrmtcolumn toprep_big_n() viavars.
Usage
prep_big_n(df, vars)Arguments
df | (data.frame) |
vars | (character) a vector of variables to prepare |
Value
a data.frame with the same columns as the input. Thestat_namecolumn is modified.
Examples
df <- data.frame( stat_name = c("n", "max", "min", rep(c("n", "N", "p"), times = 2)), context = rep(c("continuous", "hierarchical", "categorical"), each = 3), stat_variable = rep(c("a", "b", "c"), each = 3)) |> dplyr::bind_rows( data.frame( stat_name = "n", context = "total_n", stat_variable = "d" ) )prep_big_n( df, vars = c("b", "c"))Combine variables
Description
A wrapper aroundtidyr::unite() which pastes several columns into one.In addition it checks the output is identical todplyr::coalesce(). If notidentical, the input data.frame is returned unchanged. Useful for unitingsparsely populated columns, for example when processing an ard that wascreated withcards::ard_stack() then shuffled with[shuffle_card()].
If the data is the result of a hierarchical ard stack (withcards::ard_stack_hierarchical() orcards::ard_stack_hierarchical_count()), the input is returned unchanged.This is assessed from the information in thecontext column which needs tobe present. If the input data does not have acontext column, the inputwill be returned unmodified.
Usage
prep_combine_vars(df, vars, remove = TRUE)Arguments
df | (data.frame) |
vars | (character) a vector of variables to unite. If a single variableis supplied, the input is returned unchanged. |
remove | If |
Value
a data.frame with an additional column, calledvariable_level orthe input unchanged.
Examples
df <- data.frame( a = 1:6, context = rep("categorical", 6), b = c("a", rep(NA, 5)), c = c(NA, "b", rep(NA, 4)), d = c(NA, NA, "c", rep(NA, 3)), e = c(NA, NA, NA, "d", rep(NA, 2)), f = c(NA, NA, NA, NA, "e", NA), g = c(rep(NA, 5), "f"))prep_combine_vars( df, vars = c("b", "c", "d", "e", "f", "g"))Fill missing values in hierarchical variables
Description
ReplaceNA values in one column conditional on the same row having anon-NA value in a different column.
The user supplies a vector of columns from which the pairs will be extractedwith a rolling window. For examplevars <- c("A", "B", "C") will generate2 pairs("A", "B") and("B", "C"). Therefore the order of the variablesmatters.
In each pair the second columnB will be filled ifA is not missing. Onecan choose the value to fill with:
"Any {colname}", in this case evaluating to"Any B"is the default.Any other value. For example
"Any event"for an adverse effects table.the value of pair's first column. In this case, the value of
A.
Usage
prep_hierarchical_fill( df, vars, fill = "Any {colname}", fill_from_left = FALSE)Arguments
df | (data.frame) |
vars | (character) a vector of variables to generate pairs from. |
fill | (character) value to replace with. Defaults to |
fill_from_left | (logical) indicating whether to fill from the left(first) column in the pair. Defaults to |
Value
a data.frame with the same columns as the input, but in which somethe desired columns have been filled pairwise.
Examples
df <- data.frame( x = c(1, 2, NA), y = c("a", NA, "b"), z = rep(NA, 3))prep_hierarchical_fill( df, vars = c("x", "y"))prep_hierarchical_fill( df, vars = c("x", "y"), fill = "foo")prep_hierarchical_fill( df, vars = c("x", "y", "z"), fill_from_left = TRUE)Prepare label
Description
Adds alabel column which is a combination ofstat_label (for continuousvariables) andvariable_level (for categorical ones) if these 2 columns arepresent in the input data frame.
Usage
prep_label(df)Arguments
df | (data.frame) |
Value
a data.frame with alabel column (if the input has the requiredcolumns) or the input unchanged.
Examples
df <- data.frame( variable_level = c("d", "e", "f"), stat_label = c("a", "b", "c"), stat_name = c("n", "N", "n"), context = c("categorical", "continuous", "hierarchical"))prep_label(df)Print mock table to GT
Description
Print mock table to GT
Usage
print_mock_gt( tfrmt, .data = NULL, .default = 1:3, n_cols = NULL, .unicode_ws = TRUE)Arguments
tfrmt | tfrmt the mock table will be based off of |
.data | Optional data. If this is missing, group values, labels valuesand parameter values will be estimated based on the tfrmt |
.default | sequence to replace the default values if a dataset isn'tprovided |
n_cols | the number of columns. This will only be used if mock data isn'tprovided. If not supplied, it will default to using the |
.unicode_ws | Whether to convert white space to unicode in preparation for output |
Value
a stylized gt object
Examples
# Create tfrmt specification tfrmt_spec <- tfrmt( label = label, column = column, param = param, body_plan = body_plan( frmt_structure(group_val = ".default", label_val = ".default", frmt_combine( "{count} {percent}", count = frmt("xxx"), percent = frmt_when("==100"~ frmt(""), "==0"~ "", "TRUE" ~ frmt("(xx.x%)")))) )) # Print mock table using default print_mock_gt(tfrmt = tfrmt_spec)
# Create mock data df <- crossing(label = c("label 1", "label 2", "label 3"), column = c("placebo", "trt1", "trt2"), param = c("count", "percent")) # Print mock table using mock data print_mock_gt(tfrmt_spec, df)
Print to ggplot
Description
Print to ggplot
Usage
print_to_ggplot(tfrmt, .data, ...)Arguments
tfrmt | tfrmt object that will dictate the structure of the ggplot object |
.data | Data to style in order to make the ggplot object |
... | Inputs to geom_text to modify the style of the table body |
Value
a stylized ggplot object
Examples
# Create datarisk<-tibble(time=c(rep(c(0,1000,2000,3000),3)), label=c(rep("Obs",4),rep("Lev",4),rep("Lev+5FU",4)), value=c(630,372,256,11,620,360,266,8,608,425,328,14), param=rep("n",12))table<-tfrmt( label = label , column = time, param = param, value = value) %>% print_to_ggplot(risk)table
Print to gt
Description
Print to gt
Usage
print_to_gt(tfrmt, .data, .unicode_ws = TRUE)Arguments
tfrmt | tfrmt object that will dictate the structure of the table |
.data | Data to style in order to make the table |
.unicode_ws | Whether to convert white space to unicode in preparation for output |
Value
a stylized gt object
Examples
library(dplyr)# Create tfrmt specificationtfrmt_spec <- tfrmt( label = label, column = column, param = param, value=value, body_plan = body_plan( frmt_structure(group_val = ".default", label_val = ".default", frmt_combine( "{count} {percent}", count = frmt("xxx"), percent = frmt_when("==100"~ frmt(""), "==0"~ "", "TRUE" ~ frmt("(xx.x%)")))) ))# Create datadf <- crossing(label = c("label 1", "label 2"), column = c("placebo", "trt1"), param = c("count", "percent")) %>% mutate(value=c(24,19,2400/48,1900/38,5,1,500/48,100/38))print_to_gt(tfrmt_spec,df)
Row Group Plan
Description
Define the look of the table groups on the output. This function allows you toadd spaces after blocks and allows you to control how the groups are viewedwhether they span the entire table or are nested as a column.
Usage
row_grp_plan(..., label_loc = element_row_grp_loc(location = "indented"))Arguments
... | Row group structure objects separated by commas |
label_loc |
|
Value
row_grp_plan object
See Also
row_grp_structure() for more details on how to specify row groupstructures,element_block() for more details on how to specify spacingbetween each group,element_row_grp_loc() for more details on how tospecify whether row group titles span the entire table or collapse.
Examples
## single grouping variable example sample_grp_plan <- row_grp_plan( row_grp_structure(group_val = c("A","C"), element_block(post_space = "---")), row_grp_structure(group_val = c("B"), element_block(post_space = " ")), label_loc = element_row_grp_loc(location = "column") ) ## example with multiple grouping variables sample_grp_plan <- row_grp_plan( row_grp_structure(group_val = list(grp1 = "A", grp2 = "b"), element_block(post_space = " ")), label_loc = element_row_grp_loc(location = "spanning") )Row Group Structure Object
Description
Function needed to create a row_grp_structure object, which is a building blockofrow_grp_plan()
Usage
row_grp_structure(group_val = ".default", element_block)Arguments
group_val | A string or a named list of strings which represent thevalue of group should be when the given frmt is implemented |
element_block | element_block() object to define the block styling |
Value
row_grp_structure object
See Also
row_grp_plan() for more details on how to group row groupstructures,element_block() for more details on how to specify spacingbetween each group.
Examples
## single grouping variable examplerow_grp_structure(group_val = c("A","C"), element_block(post_space = "---"))## example with multiple grouping variablesrow_grp_structure(group_val = list(grp1 = "A", grp2 = "b"), element_block(post_space = " "))Shufflecards
Description
This function ingests an ARD object of classcard and shuffles the information to preparefor analysis. Helpful for streamlining across multiple ARDs.
Usage
shuffle_card( x, by = NULL, trim = TRUE, order_rows = TRUE, fill_overall = "Overall {colname}", fill_hierarchical_overall = "Any {colname}")Arguments
x | an ARD data frame of class 'card' |
by | Grouping variable(s) used in calculations. Defaults to |
trim | logical representing whether or not to trim away |
order_rows | logical representing whether or not to apply |
fill_overall | scalar to fill missing grouping or variable levels. If acharacter is passed, then it is processed with |
fill_hierarchical_overall | scalar to fill variable levels for overallhierarchical calculations. If a character is passed, then it is processedwith |
Value
a tibble
Examples
## Not run: cards::bind_ard( cards::ard_categorical(cards::ADSL, by = "ARM", variables = "AGEGR1"), cards::ard_categorical(cards::ADSL, variables = "ARM")) |> shuffle_card()## End(Not run)Table Format
Description
tfrmt, or "table format" is a way to pre-define the non-data components ofyour tables, and how the data will be handled once added: i.e. title,footers, headers, span headers, and cell formats. In addition, tfrmt's can belayered, building from one table format to the next. For cases where only onevalue can be used, the newly defined tfrmt accepts the latest tfrmt
Usage
tfrmt( tfrmt_obj, group = vars(), label = quo(), param = quo(), value = quo(), column = vars(), title, subtitle, row_grp_plan, body_plan, col_style_plan, col_plan, sorting_cols, big_n, footnote_plan, page_plan, ...)Arguments
tfrmt_obj | a tfrmt object to base this new format off of |
group | what are the grouping vars of the input dataset |
label | what is the label column of the input dataset |
param | what is the param column of the input dataset |
value | what is the value column of the input dataset |
column | what is the column names column in the input dataset |
title | title of the table |
subtitle | subtitle of the table |
row_grp_plan | plan of the row groups blocking. Takes a |
body_plan | combination and formatting of the input data. Takes a |
col_style_plan | how to style columns including alignment (left, right, character) and width. Takes a |
col_plan | a col_plan object which is used to select, rename, and nestcolumns. Takes a |
sorting_cols | which columns determine sorting of output |
big_n | how to format subject totals ("big Ns") for inclusion in the column labels. Takes a |
footnote_plan | footnotes to be added to the table. Takes a |
page_plan | pagination splits to be applied to the table. Takes a |
... | These dots are for future extensions and must be empty. |
Details
NSE and Argument Evaluation
tfrmt allows users to pass
vars,quo, and unquoted expressions to avariety of arguments, such asgroup,label,param,value,column, andsorting_cols. Users accustomed to tidyverse semanticsshould be familiar with this behaviour. However, there is an importantbehaviour difference between tfrmt and normal tidyverse functions. Becausethe data are not a part of tfrmt, it does not know when a value beingpassed to it is intended to be an unquoted expression representing a columnname or an object from the environment. As such, it preferentially uses thevalue from the environment over preserving the entry as an expression. Forexample, if you have an object "my_object" in yourenvironment with the value "Hello world", and try to create a tfrmt astfrmt(column = my_object), it will take the value of "my_object" overassuming the column argument is an unquoted expression and view the entrytocolumnas "Hello World". To pass "my_object" to tfrmt as a column name, usequotes around the value:tfrmt(columnn = "my_object").Additionally, unquoted expressions that match
tfrmt's otherargument names can cause unexpected results. It is recommendedto put quotes around the value as such:tfrmt(label = "group"). In this case, the quoting will preventtfrmtfrom assigning itsgroupinput value to thelabelvalue.
Value
tfrmt object
Images
Here are some example outputs: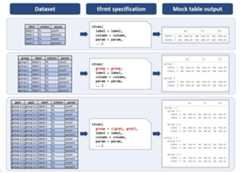
See Also
Examples
tfrmt_spec <- tfrmt( label = label, column = column, param = param, value=value)tfrmt_spec <- tfrmt( label = label, column = column, param = param, value=value,# Set the formatting for values body_plan = body_plan( frmt_structure( group_val = ".default", label_val = ".default", frmt_combine("{n} {pct}", n = frmt("xxx"), pct = frmt_when( "==100" ~ "(100%)", "==0" ~ "", TRUE ~ frmt("(xx.x %)") ) ) ) ),# Specify column styling plan col_style_plan = col_style_plan( col_style_structure(col = vars(everything()), align = c(".",","," ")) ))tfrmt_spec <- tfrmt( group = group, label = label, column = column, param = param, value=value, sorting_cols = c(ord1, ord2), # specify value formatting body_plan = body_plan( frmt_structure( group_val = ".default", label_val = ".default", frmt_combine("{n} {pct}", n = frmt("xxx"), pct = frmt_when( "==100" ~ "(100%)", "==0" ~ "", TRUE ~ frmt("(xx.x %)") ) ) ), frmt_structure( group_val = ".default", label_val = "n", frmt("xxx") ), frmt_structure( group_val = ".default", label_val = c("Mean", "Median", "Min","Max"), frmt("xxx.x") ), frmt_structure( group_val = ".default", label_val = "SD", frmt("xxx.xx") ), frmt_structure( group_val = ".default", label_val = ".default", p = frmt("") ), frmt_structure( group_val = ".default", label_val = c("n","<65 yrs","<12 months","<25"), p = frmt_when( ">0.99" ~ ">0.99", "<0.001" ~ "<0.001", TRUE ~ frmt("x.xxx", missing = "") ) ) ), # remove extra cols col_plan = col_plan(-grp, -starts_with("ord") ), # Specify column styling plan col_style_plan = col_style_plan( col_style_structure(col = vars(everything()), align = c(".",","," ")) ), # Specify row group plan row_grp_plan = row_grp_plan( row_grp_structure( group_val = ".default", element_block(post_space = " ") ), label_loc = element_row_grp_loc(location = "column") ))N Percent Template
Description
This function creates an tfrmt for an n % table, so count based table. Theparameter values for n and percent can be provided (by default it will assumen andpct). Additionally thefrmt_when for formatting the percent canbe specified. By default 100% and 0% will not appear and everything between99% and 100% and 0% and 1% will be rounded using greater than (>) and lessthan (<) signs respectively.
Usage
tfrmt_n_pct( n = "n", pct = "pct", pct_frmt_when = frmt_when("==100" ~ frmt(""), ">99" ~ frmt("(>99%)"), "==0" ~ "", "<1" ~ frmt("(<1%)"), "TRUE" ~ frmt("(xx.x%)")), tfrmt_obj = NULL)Arguments
n | name of count (n) value in the parameter column |
pct | name of percent (pct) value in the parameter column |
pct_frmt_when | formatting to be used on the the percent values |
tfrmt_obj | an optional tfrmt object to layer |
Value
tfrmt object
Examples
print_mock_gt(tfrmt_n_pct())

Create tfrmt object from significant digits spec
Description
This function creates a tfrmt based on significant digits specifications forgroup/label values. The input data spec provided tosigdig_df will containgroup/label value specifications.tfrmt_sigdig assumes that these columnsare group columns unless otherwise specified. The user may optionally chooseto pass the names of the group and/or label columns as arguments to thefunction.
Usage
tfrmt_sigdig( sigdig_df, group = vars(), label = quo(), param_defaults = param_set(), missing = NULL, tfrmt_obj = NULL, ...)Arguments
sigdig_df | data frame containing significant digits formatting spec.Has 1 record per group/label value, and columns for relevant group and/orlabel variables, as well as a numeric column |
group | what are the grouping vars of the input dataset |
label | what is the label column of the input dataset |
param_defaults | Option to override or add to default parameters. |
missing | missing option to be included in all |
tfrmt_obj | an optional tfrmt object to layer |
... | These dots are for future extensions and must be empty. |
Details
Formats covered
Currently covers specifications forfrmt andfrmt_combine.frmt_when not supported and must be supplied in additionaltfrmt that is layered on.
Group/label variables
If the group/label variables are not provided to the arguments, the body_planwill be constructed from the input data with the following behaviour:
If no group or label are supplied, it will be assumed that all columns in the inputdata are group columns.
If a label variable is provided, but nothing isspecified for group, any leftover columns (i.e. not matching
sigdigor thesupplied label variable name) in the input data will be assumed to be groupcolumns.If any group variable is provided, any leftover columns (i.e. notmatching
sigdigor the supplied group/label variable) will be disregarded.
Value
tfrmt object with abody_plan constructed based on thesignificant digits data spec and param-level significant digits defaults.
Examples
sig_input <- tibble::tribble( ~group1, ~group2, ~sigdig, "CHEMISTRY", ".default", 3, "CHEMISTRY", "ALBUMIN", 1, "CHEMISTRY", "CALCIUM", 1, ".default", ".default", 2)# Subset data for the exampledata <- dplyr::filter(data_labs, group2 == "BASOPHILS", col1 %in% c("Placebo", "Xanomeline Low Dose"))tfrmt_sigdig(sigdig_df = sig_input, group = vars(group1, group2), label = rowlbl, param_defaults = param_set("[{n}]" = NA)) %>% tfrmt(column = vars(col1, col2), param = param, value = value, sorting_cols = vars(ord1, ord2, ord3), col_plan = col_plan(-starts_with("ord"))) %>% print_to_gt(.data = data)
Print to JSON
Description
Print to JSON
Usage
tfrmt_to_json(tfrmt, path = NULL)Arguments
tfrmt | tfrmt to print |
path | file path to save JSON to. If not provided the JSON will just print to the console |
Value
JSON
Examples
tfrmt( label = label, column = column, param = param, value=value) %>% tfrmt_to_json()Remap group values in a tfrmt
Description
Remap group values in a tfrmt
Usage
update_group(tfrmt, ...)Arguments
tfrmt | a |
... | Use new_name = old_name to rename selected variables |
Value
Atfrmt with thegroup variables updated in all places
tfrmt object with updated groups#'
Examples
tfrmt_spec <- tfrmt( group = c(group1, group2), body_plan = body_plan( frmt_structure( group_val = list(group2 = "value"), label_val = ".default", frmt("XXX") ), frmt_structure( group_val = list(group1 = "value", group2 = "value"), label_val = ".default", frmt("XXX") ) ))tfrmt_spec %>% update_group(New_Group = group1)