The goal ofpaar is to provide useful functions forprecision agriculture spatial data depuration.
You can install the released version of paar fromCRAN with (not-yet):
# install.packages("paar")You can install the development version fromGitHub with:
# install.packages("devtools")devtools::install_github("PPaccioretti/paar")The package has a complete protocol for automating error removal.Default values of all functions are optimized for precision agriculturaldata.
library(paar)library(sf)#> Warning: package 'sf' was built under R version 4.3.3data("barley",package ='paar')barley data contains barley grain yield which wereobtained using calibrated commercial yield monitors, mounted on combinesequipped with DGPS.
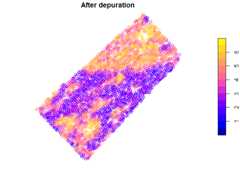
#Convert barley data to an spatial objectbarley_sf<-st_as_sf(barley,coords =c("X","Y"),crs =32720)barley_dep<-depurate(barley_sf,"Yield")#> Concave hull algorithm is computed with#> concavity = 2 and length_threshold = 0# Summary of depurated datasummary(barley_dep)#> normal point border spatial outlier MP spatial outlier LM#> 5673 (77%) 964 (13%) 343 (4.6%) 309 (4.2%)#> global min outlier#> 99 (1.3%) 6 (0.081%)Spatial yield values before and after depuration process can beplotted
plot(barley_sf["Yield"],main ="Before depuration")plot(barley_dep$depurated_data["Yield"],main ="After depuration")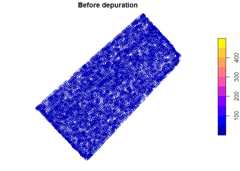
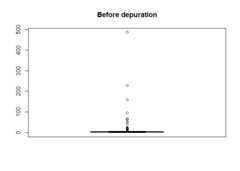
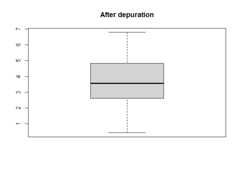
Also distribution of yield values can be plotted
boxplot(barley_sf[["Yield"]],main ="Before depuration")boxplot(barley_dep$depurated_data[["Yield"]],main ="After depuration")