

An R package for creating interactive web graphics via the opensource JavaScript graphing libraryplotly.js.

Install from CRAN:
install.packages("plotly")Or install the latest development version (on GitHub) via{remotes}:
remotes::install_github("plotly/plotly")If you useggplot2,ggplotly() converts your static plots to an interactiveweb-based version!
library(plotly)g<-ggplot(faithful,aes(x = eruptions,y = waiting))+stat_density_2d(aes(fill = ..level..),geom ="polygon")+xlim(1,6)+ylim(40,100)ggplotly(g)
By default,ggplotly() tries to replicate the staticggplot2 version exactly (before any interaction occurs), but sometimesyou need greater control over the interactive behavior. Theggplotly() function itself has some convenient “high-level”arguments, such asdynamicTicks, which tells plotly.js todynamically recompute axes, when appropriate. Thestyle()function also comes in handy formodifying the underlying traceattributes (e.g. hoveron) usedto generate the plot:
gg<-ggplotly(g,dynamicTicks ="y")style(gg,hoveron ="points",hoverinfo ="x+y+text",hoverlabel =list(bgcolor ="white"))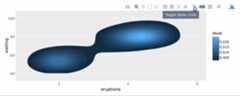
Moreover, sinceggplotly() returns a plotly object, youcan apply essentially any function from the R package on that object.Some useful ones includelayout() (forcustomizingthe layout),add_traces() (and its higher-leveladd_*() siblings, for exampleadd_polygons(),foraddingnew traces/data),subplot() (forcombiningmultiple plotly objects), andplotly_json() (forinspecting the underlying JSON sent to plotly.js).
Theggplotly() function will also respect some“unofficial”ggplot2 aesthetics, namelytext (forcustomizingthe tooltip),frame (forcreatinganimations), andids (for ensuring sensible smoothtransitions).
Theplot_ly() function provides a more direct interfaceto plotly.js so you can leverage more specialized chart types (e.g.,parallelcoordinates ormaps) oreven some visualization that the ggplot2 API won’t ever support (e.g.,surface,mesh,trisurf, etc).
plot_ly(z =~volcano,type ="surface")
To learn more about special features that the plotly R packageprovides (e.g.,client-sidelinking,shinyintegration,editing andgenerating static images,custom events inJavaScript, and more), seehttps://plotly-r.com. You may already be familiar withexisting plotly documentation (e.g.,https://plotly.com/r/), which is essentially alanguage-agnostic how-to guide for learning plotly.js, whereashttps://plotly-r.com ismeant to be more wholistic tutorial written by and for the R user. Thepackage itself ships with a number of demos (list them by runningdemo(package = "plotly")) and shiny/rmarkdown examples(list them by runningplotly_example("shiny") orplotly_example("rmd")).Carson also keeps numerousslide decks with useful examplesand concepts.
Please read through ourcontributingguidelines. Included are directions for opening issues, askingquestions, contributing changes to plotly, and our code of conduct.