
This package offers implementation of analytical and sampling-basedpower analyses for the Wald, LR, score, and gradient tests in theframeworks of linear hypotheses and marginal maximum likelihoodestimation. The methods are described in our paper (Zimmer etal. (2022),https://doi.org/10.1007/s11336-022-09883-5).
You can install the CRAN version using:
install.packages("irtpwr")Or, you can install the development version of irtpwr fromGitHub with:
# install.packages('devtools')devtools::install_github("flxzimmer/irtpwr",build_vignettes =TRUE)We can load the irtpwr package using:
library(irtpwr)library(mirt)#> Loading required package: stats4#> Loading required package: latticeWe want to know the power and the required sample size for a test ofthe Rasch vs 2PL model. We use the LSAT 7 data set which is included themirt package.
As a first step, we load the data set and fit a 2PL model.
dat<-expand.table(LSAT7)mirtfit<-mirt(dat,1,verbose =FALSE)The 2PL parameters are then used as parameters for the alternativehypothesis in our hypothesis definition.
hyp<-setup.hypothesis(type ="1PLvs2PL",altpars = mirtfit)We can now perform the power analysis. We want to determine thesample size necessary for a power of .8 while using an alpha level of.05.
res<-irtpwr(hyp = hyp,power =0.8,alpha =0.05)summary(res)#>#> Sample sizes for power = 0.8 (alpha = 0.05):#>#> Statistic N#> Wald 1134#> LR 887#> Score 932#> Gradient 778#>#> Method: AnalyticalHere we see that the gradient statistic would be the most efficientto test our hypothesis: We would need a sample size of 778 to reach ourdesired power.
We can also plot the power curves to get a more detailed look on therelationships between sample size and power:
plot(res)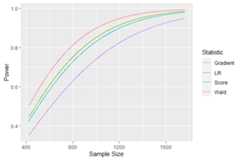
Further documentation on how to use the package is found in thepackage vignettes:
If the vignettes were included during installation (for example usingthe methods above), they can be accessed via:
browsevignettes("irtpwr")