

elfgen is an instream flow framework for rapid generation andoptimization of flow-ecology relations. The elfgen framework centers onthe generation of Ecological Limit Function models (ELFs) describing therelation between maximum species richness and stream size characteristic(streamflow or drainage area). The elfgen framework was developed (ByDEQ in cooperation with USGS and Virginia Tech) in response to a needfor better environmental flow metrics for assessment of potentialimpacts of water use. For the first time this new framework may allowquantification of potential species loss resulting from flow change, andmay offer an improved understanding of aquatic life risk variability dueto geographic location, stream size and local scale.
Supporting manuscripts have been published in the Journal of theAmerican Water Resources Association (JAWRA): -elfgen: A NewInstream Flow Framework for Rapid Generation and Optimization ofFlow–Ecology Relations. - Kleiner et al. (2020):https://onlinelibrary.wiley.com/doi/full/10.1111/1752-1688.12876 -Application of a New Species-Richness Based Flow Ecology Frameworkfor Assessing Flow Reduction Effects on Aquatic Communities - Rappet al. (2020):https://onlinelibrary.wiley.com/doi/full/10.1111/1752-1688.12877
# Install the current released version from CRAN:install.packages("elfgen")# Or install the development version from Github:# install.packages("devtools")devtools::install_github("HARPgroup/elfgen")An introductory example of how elfgen works is supplied below. Youstart by either supplying a dataset with flow and richness data, or bysupplying a HUC code of interest. When supplying a HUC code:elfdata() will retrieve IchthyMaps data from USGSScienceBase using thesbtools package and automaticallyderive fish species richness at the NHDPlusV2 segment scale. Mean annualflow data is then automatically retrieved for each NHDPlusV2 segmentusing thenhdplusTools package.
A breakpoint in the flow-ecology relation is determined using a fixeduser-defined value, or identified using the functionsbkpt_pwit() orbkpt_ymax(). The ELF model isthen generated and plotted usingelfgen() with ELF modelstatistics returned.
Additional richness change analyses may be performed using thefunctionsrichness_change() andelfchange()(See below)
library(elfgen)# Retrieve dataset of interest# You may enter either a 6, 8, 10, or 12-digit HUC code# *Notes:# By default the ichthy dataset is downloaded to a temp directory, however this may be overridden by# supplying a local path of interest using the input parameter "ichthy.localpath"# 6-digit HUCs like the following example may take a few minutes to process with elfdata() due to the# large number of contained IchthyMaps historical stream fish distribution datawatershed.df<-elfdata(watershed.code ='02080201',ichthy.localpath =tempdir())# Alternatively, utilize a user-supplied dataset in the following format:watershed.df<-data.frame(flow=c(28.257,20.254,22.825, ...),richness=c(2,10,12, ...),watershed='02080201',stringsAsFactors=FALSE)"quantile" forisolating an upper subset of the data. A user also identifies a boundingrange between two x-values ("blo" = “bound low”,"bhi" = “bound high”) in which the upper subest of data isbelieved to contain a breakpoint. (Note: Small datasets may not containa breakpoint)# Fixed Methodbreakpt<-500# Piecewise Iterative Methodbreakpt<-bkpt_pwit("watershed.df"= watershed.df,"quantile"=0.95,"blo"=200,"bhi"=500)#> [1] "Breakpoint identified at 310.815"# Ymax Methodbreakpt<-bkpt_ymax("watershed.df"= watershed.df)#> [1] "Breakpoint identified at 142.989""quantile" for isolating the uppersubset of the data. The breakpoint"breakpt" determinedusing one of the above methods is passed in."yaxis_thresh"is used to customize the maximum y-axis limit. Custom x-axis and y-axisplot labels can be specified using"xlabel" and"ylabel" respectively.elf<-elfgen("watershed.df"= watershed.df,"quantile"=0.95,"breakpt"= breakpt,"yaxis_thresh"=53,"xlabel"="Mean Annual Flow (ft3/s)","ylabel"="Fish Species Richness")elf$plot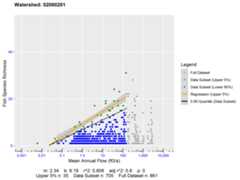
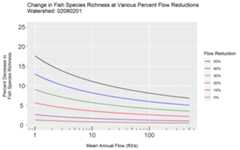
elf$stats#> watershed breakpt quantile m b rsquared rsquared_adj p n_total n_subset n_subset_upper#> 1 02080201 142.989 0.95 2.34 9.19 0.806 0.8 0 861 705 35richness_change() and input the percent reduction in flow"pctchg" (10 = 10% reduction in flow)"xval"parameter is supplied, the function will calculate the percent change inrichness at a specific stream size (For this example 50 = a stream sizewith mean annual flow of 50 cfs)# Calculate absolute richness change (resulting from flow reduction)richness_change(elf$stats,"pctchg"=10)#> [1] "Absolute Richness Change:"#> [1] -0.2465436# Calculate percent richness change at a specific stream sizerichness_change(elf$stats,"pctchg"=10,"xval"=50)#> [1] "Percent Richness Change at x = 50:"#> [1] -1.343992elfchange()."yaxis_thresh" is used tocustomize the maximum y-axis limit. Custom x-axis and y-axis plot labelscan be specified using"xlabel" and"ylabel"respectively.# Generate plot of percent richness change for various percent flow reductionselfchange(elf$stats,"yaxis_thresh"=25)