


Contains ggplot2 geom for plotting brain atlases using simplefeatures. The largest component of the package is the data for the twobuilt-in atlases. Plotting results of analyses on regions or networksoften involves swapping between statistical tools, like R, and softwarefor brain imaging to correctly visualise analysis results.
This package aims to make it possible to plot results directlythrough R.
There are currently four atlases available in the package:
dk - Desikan-Killiany atlas (aparc).aseg - Automatic subcortical segmentation.Note: As of version 1.5.3,ggseg wassplit into two packages: one for 2d polygon plots in ggplot, and anotherfor 3d mesh plots through plotly. This was done to reduce package size,dependencies, and also to simplify maintenance. If you want the 3dplotting tool, please go theggseg3d repository.
You may find more atlases and functions to create new atlases in thecompanion packageggsegExtra.
The package can be installed from CRAN.
install.packages("ggseg")Alternatively, ggseg may also be installed through its ggsegr-universe:
# Enable this universeoptions(repos =c(ggseg ='https://ggseg.r-universe.dev',CRAN ='https://cloud.r-project.org'))# Install some packagesinstall.packages('ggseg')The development version of the package can be installed usingdevtools.
install.packages("remotes")remotes::install_github("ggseg/ggseg")The functions are now installed, and you may load them when you wantto use them. All functions are documented in standard R fashion.
library(ggseg)library(ggplot2)plot(dk)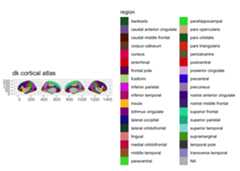
plot(aseg)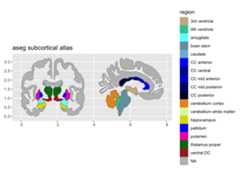
While default atlas plots will give you an idea of how the atlaseslook, you will likely want to project your own data onto the plot.
library(dplyr)#>#> Attaching package: 'dplyr'#> The following objects are masked from 'package:stats':#>#> filter, lag#> The following objects are masked from 'package:base':#>#> intersect, setdiff, setequal, unionsomeData<-tibble(region =rep(c("transverse temporal","insula","precentral","superior parietal"),2),p =sample(seq(0,.5,.001),8),groups =c(rep("g1",4),rep("g2",4)))someData%>%group_by(groups)%>%ggplot()+geom_brain(atlas = dk,position =position_brain(hemi~ side),aes(fill = p))+facet_wrap(~groups)#> merging atlas and data by 'region'
The package also has several vignettes, to help you get started usingit. You can access ithere
You can also see one of the creators blog for introductions to itsusehere
Don’t hesitate to ask for support usinggithub issues, orrequesting new atlases. While we would love getting help in creating newatlases, you may also request atlases through the issues, and we willtry to get to it.
This tool is partly funded by:
EU Horizon 2020 Grant: Healthy minds 0-100 years:Optimising the use of European brain imaging cohorts (Lifebrain).
Grant agreement number: 732592.
Call: Societal challenges: Health, demographicchange and well-being