


tbrf is retired. I will maintain the package to ensure it remains onCRAN but do not expect additional functionality or improvements. Ihighly recommendrunnerfor the same functionality but faster!
The goal of tbrf is to provide time-window based rolling statisticalfunctions. The package differs from other rolling statistic packagesbecause the intended use is for irregular measured data. Although tbrfcan be used to apply statistical functions to regularly sampled data,zoo,RcppRoll,and other packages provide fast, efficient, and rich implementations ofrolling/windowed functions.
An appropriate example case is water quality data that is measured atirregular time intervals. Regulatory compliance is often based on astatistical average measure or exceedance probability applied to allsamples collected in the previous 7-years. tbrf can be used to displayregulatory status at any sample point.
tbrf identifies the previous n measurements within the specified timewindow, applies the function, and outputs a variable with the result ofthe rolling statistical measure.
tbrf is available on CRAN:
install.packages("tbrf")The development version is available on r-universe and can beinstalled as:
install.packages('tbrf', repos = c('https://mps9506.r-universe.dev', 'https://cloud.r-project.org'))tbr_binom: Rolling binomial probability withconfidence intervals.
tbr_gmean: Rolling geometric mean with confidenceintervals.
tbr_mean: Rolling mean with confidenceintervals.
tbr_median: Rolling median with confidenceintervals.
tbr_misc: Accepts user specified function.
tbr_sd: Rolling standard deviation.
tbr_sum: Rolling sum.
See:
https://mps9506.github.io/tbrf/
Plot a rolling 1-hour mean:
library(tbrf)library(dplyr)library(ggplot2)y = 3 * sin(2 * seq(from = 0, to = 4*pi, length.out = 100)) + rnorm(100)time = sample(seq(as.POSIXct(strptime("2017-01-01 00:01:00", "%Y-%m-%d %H:%M:%S")), as.POSIXct(strptime("2017-01-01 23:00:00", "%Y-%m-%d %H:%M:%S")), by = "min"), 100)df <- tibble(y, time)df %>% tbr_mean(y, time, "hours", n = 1) %>% ggplot() + geom_point(aes(time, y)) + geom_step(aes(time, mean))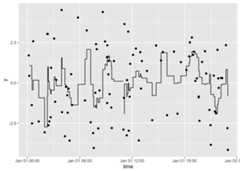
Plot a rolling 3-hour mean:
df %>% tbr_mean(y, time, "hours", n = 3) %>% ggplot() + geom_point(aes(time, y)) + geom_step(aes(time, mean))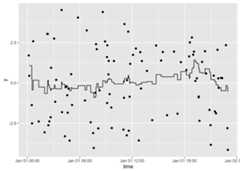
Please note that this project is released with aContributorCode of Conduct. By participating in this project you agree to abideby its terms.
tbrf code is released under GPL-3 | LICENSE.md
binom_ci() is an implementation of code licensed underGPL (>=2) by Frank Harrell’sHmiscpackage.
stat_stepribbon() is an implementation of code licensedunder MIT by Bob Rudis’sggaltpackage.
If you can cite the use of this software, please usecitation("tbrf") .
.
library(tbrf)date()## [1] "Tue Aug 19 13:32:27 2025"devtools::test()## ✔ | F W S OK | Context## ## ⠏ | 0 | expectedClass ## ⠏ | 0 | core functions work in piped workflow ## ⠙ | 2 | core functions work in piped workflow ## ✔ | 6 | core functions work in piped workflow## ## ⠏ | 0 | expectedMessages ## ⠏ | 0 | core functions return expected errors and messages ## ⠹ | 3 | core functions return expected errors and messages ## ⠴ | 6 | core functions return expected errors and messages ## ✔ | 7 | core functions return expected errors and messages## ## ⠏ | 0 | expectedValues ## ⠏ | 0 | core functions return expected structures and values ## ⠹ | 3 | core functions return expected structures and values ## ⠼ | 5 | core functions return expected structures and values ## ⠴ | 6 | core functions return expected structures and values ## ✔ | 6 | core functions return expected structures and values## ## ⠏ | 0 | internalStatsFunctions ## ⠏ | 0 | internal statistical functions return expected values ## ⠼ | 5 | internal statistical functions return expected values ## ✔ | 17 | internal statistical functions return expected values## ## ══ Results ═════════════════════════════════════════════════════════════════════## Duration: 1.4 s## ## [ FAIL 0 | WARN 0 | SKIP 0 | PASS 36 ]