Partitioning using local subregions (PULS) is a clustering techniquedesigned to explore subregions of functional data for information tosplit the curves into clusters.
You can install the released version of puls fromCRAN with:
install.packages("puls")And the development version fromGitHub with:
# install.packages("remotes")remotes::install_github("vinhtantran/puls")This is a basic example which shows you how to solve a commonproblem:
library(puls)library(fda)#> Loading required package: splines#> Loading required package: fds#> Loading required package: rainbow#> Loading required package: MASS#> Loading required package: pcaPP#> Loading required package: RCurl#> Loading required package: deSolve#>#> Attaching package: 'fda'#> The following object is masked from 'package:graphics':#>#> matplot#> The following object is masked from 'package:datasets':#>#> gait# Build a simple fd object from already smoothed smoothed_arcticdata(smoothed_arctic)NBASIS<-300NORDER<-4y<-t(as.matrix(smoothed_arctic[,-1]))splinebasis<-create.bspline.basis(rangeval =c(1,365),nbasis = NBASIS,norder = NORDER)fdParobj<-fdPar(fdobj = splinebasis,Lfdobj =2,# No need for any more smoothinglambda = .000001)yfd<-smooth.basis(argvals =1:365,y = y,fdParobj = fdParobj)Jan<-c(1,31); Feb<-c(31,59); Mar<-c(59,90)Apr<-c(90,120); May<-c(120,151); Jun<-c(151,181)Jul<-c(181,212); Aug<-c(212,243); Sep<-c(243,273)Oct<-c(273,304); Nov<-c(304,334); Dec<-c(334,365)intervals<-rbind(Jan, Feb, Mar, Apr, May, Jun, Jul, Aug, Sep, Oct, Nov, Dec)PULS4_pam<-PULS(toclust.fd = yfd$fd,intervals = intervals,nclusters =4,method ="pam")PULS4_pam#> n = 39#>#> Node) Split, N, Cluster Inertia, Proportion Inertia Explained,#> * denotes terminal node#>#> 1) root 39 8453.2190 0.7072663#> 2) Jul 15 885.3640 0.8431711#> 4) Aug 8 311.7792 *#> 5) Aug 7 178.8687 *#> 3) Jul 24 1589.1780 0.7964770#> 6) Jul 13 463.8466 *#> 7) Jul 11 371.2143 *#>#> Note: One or more of the splits chosen had an alternative split that reduced inertia by the same amount. See "alt" column of "frame" object for details.You can make a tree plot:
plot(PULS4_pam)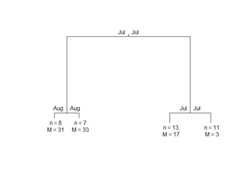
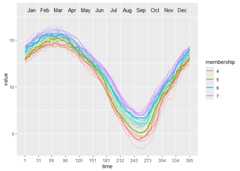
Or, a wave plot:
ggwave(toclust.fd = yfd$fd,intervals = intervals,puls = PULS4_pam)