hJAM is a hierarchical model which unifies the framework of MendelianRandomization and Transcriptome-wide association studies.
You can install the development version fromGitHub with:
if (!require("devtools")) {install.packages("devtools") }else {}devtools::install_github("lailylajiang/hJAM")This is a basic example of fitting hJAM model:
library(hJAM)# Download the data for data example 2 from the packagedata(Gl)data(betas.Gy)data(marginal_A)If you don’t have conditional A matrix, you can useget_cond_A (if more than one X) orget_cond_alpha (if only one X) to convert the marginaleffects to conditional A matrix with the reference panel.
conditional_A=get_cond_A(marginal_A = marginal_A,Gl = Gl,N.Gx =339224,ridgeTerm = T)conditional_alpha=get_cond_alpha(alphas = marginal_A[,1],Gl = Gl,N.Gx =339224,ridgeTerm = T)After obtained the conditional A matrix, fit hJAM model with functionhJAM_lnreg.
# fit the hJAM modelhJAM_lnreg(betas.Gy = betas.Gy,Gl = Gl,N.Gy =459324,A = conditional_A,ridgeTerm = T)#> ------------------------------------------------------#> hJAM output#> ------------------------------------------------------#> Number of SNPs used in model: 210#>#> Estimate StdErr 95% CI Pvalue#> bmi 0.322 0.061 (0.202, 0.442) 3.189944e-07#> t2d 0.119 0.017 (0.085, 0.153) 4.124526e-11#> ------------------------------------------------------In the package, you could also implement hJAM with Egger regression,which is designed to detect the unmeasured pleiotropy effect. Thefunction for hJAM with Egger regression ishJAM_egger.
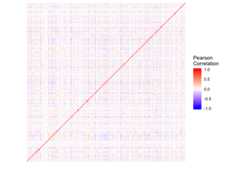
# fit the hJAM modelhJAM_egger(betas.Gy = betas.Gy,Gl = Gl,N.Gy =459324,A = conditional_A,ridgeTerm = T)#> ------------------------------------------------------#> hJAM egger output#> ------------------------------------------------------#> Number of SNPs used in model: 210#>#> Estimate StdErr 95% CI Pvalue#> bmi 0.302 0.070 (0.163, 0.44) 2.817908e-05#> t2d 0.107 0.027 (0.055, 0.16) 8.175202e-05#>#> Intercept#> Est.Int StdErr.Int 95% CI.Int Pvalue.Int#> [1,] "0.453" "0.787" "(-1.099, 2.005)" "0.565"#> ------------------------------------------------------The user could useSNPs_heatmap andSNPs_scatter_plot to display the correlation and pattern ofthe SNPs that the user used in the analysis.
scatter_plot_p=SNPs_scatter_plot(A = conditional_A,betas.Gy = betas.Gy,num_X =2)scatter_plot_p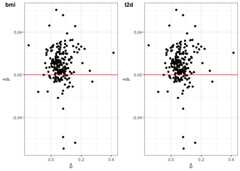
heatmap_p=SNPs_heatmap(Gl)heatmap_p