


Theroahd (Robust Analysis of High-dimensionalData) package allows to use a set of statistical tools for theexploration androbustification of univariate andmultivariatefunctional datasets through the use ofdepth-based statistical methods.
In the implementation of functions, special attention was put totheir efficiency, so that they can be profitably used also for theanalysis of high-dimensional datasets.
For a full-featured description of the package, please take a look attheroahdvignette.
Install the released version ofroahd from CRAN:
install.packages("roahd")Or install the development version from GitHub with:
# install.packages("remotes")remotes::install_github("astamm/roahd")fDataandmfDataobjectsA simpleS3 representation of functional data object,fData,allows to encapsulate the important features of univariate functionaldatasets (like the grid of the dependent variable, the pointwiseobservations, etc.):
library(roahd)# Grid representing the dependent variablegrid=seq(0,1,length.out =100 )# Pointwise measurements of the functional datasetData=matrix(c(sin(2* pi* grid ),cos (2* pi* grid ),sin(2* pi* grid+ pi/4 ) ),ncol =100,byrow =TRUE )# S3 object encapsulating the univariate functional datasetfD=fData( grid, Data )# S3 representation of a multivariate functional datasetmfD=mfData( grid,list('comp1'= Data,'comp2'= Data ) )Also, this allows to exploit simple calls to customized functionswhich simplifies the exploratory analysis:
# Algebra of fData objectsfD+1:100fD*4fD+ fD# Subsetting fData objects (providing other fData objects)fD[1, ]fD[1,2:4]# Sample mean and (depth-based) median(s)mean( fD )mean( fD[1,10:20 ] )median_fData( fD,type ='MBD' )# Plotting functionsplot( fD )plot(mean( fD ),lwd =4,add =TRUE )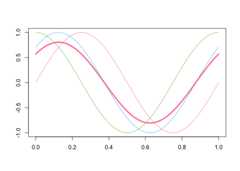
plot( fD[2:3, ] )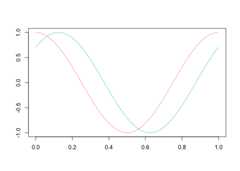
A part of the package is specifically devoted to the computation ofdepths and other statistical indices for functional data:
These also are the core of the visualization / robustification toolslike functional boxplot (fbplot)and outliergram (outliergram),allowing the visualization and identification of amplitude and shapeoutliers.
Thanks to the functions for the simulation of synthetic functionaldatasets, bothfbplotandoutliergramprocedures can be auto-tuned to the dataset at hand, in order to controlthe true positive outliers rate.
If you use this package for your own research, please cite thecorresponding R Journal article:
To cite roahd in publications use: Ieva, F., Paganoni, A. M., Romo, J., & Tarabelloni, N. (2019). roahd Package: Robust Analysis of High Dimensional Data. The R Journal, 11(2), pp. 291-307.A BibTeX entry for LaTeX users is @Article{, title = {{roahd Package: Robust Analysis of High Dimensional Data}}, author = {Francesca Ieva and Anna Maria Paganoni and Juan Romo and Nicholas Tarabelloni}, journal = {{The R Journal}}, year = {2019}, volume = {11}, number = {2}, pages = {291--307}, url = {https://doi.org/10.32614/RJ-2019-032}, }