Dependency wheels and sankey diagrams can be drawn by many RPackages, such ascirclize,networkD3, andggalluvial.These packages are very powerful and easy to use, so why bother to writeanother duplicate package? As we can see, there are some relationshipsexist between dependency wheels and sankey diagrams. So why not combinedthese two types of charts into one R function. At the same time, itwould be great to add a little interactivity to the graph.‘Highcharts’, a commercialjavascript charting library, can help me realize these ideas. By bindingR functions and the ‘Highcharts’ charting library, ‘sankeywheel’ packageprovides a simple way to draw dependency wheels and sankey diagrams.
First, you can install it fromCRAN orGitHub:
devtools::install_github('czxa/sankeywheel',build_vignettes =TRUE)# or just use gitdevtools::install_git("https://github.com/czxa/sankeywheel.git",build_vignettes =TRUE)# CRANinstall.packages("sankeywheel")Basic Usages
First, loadsankeywheel package:
library(sankeywheel)#> Highcharts (www.highcharts.com) is a Highsoft software product which is#> not free for commercial and governmental useThere is a demo dataset built in this R packages.
sankeydf is a tibble data frame with 46 rows and 3variables:
DT::datatable(sankeydf)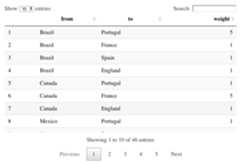
To draw dependency wheels and sankey diagrams, you need there vector,two character vectors and one numeric vector: from, to and weight.
For dependency wheels:
sankeywheel(from = sankeydf$from,to = sankeydf$to,weight = sankeydf$weight,type ="dependencywheel",width ="100%")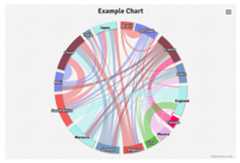
For sankey diagrams:
sankeywheel(from = sankeydf$from,to = sankeydf$to,weight = sankeydf$weight,type ="sankey",width ="100%")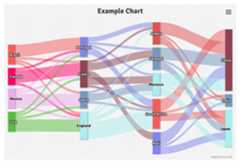
Theme parameter
I hate complex codes, so I built some themes in this package. Justchange theme parameter, you can render charts in differentapperances.
If there are multiple charts created by this package in a RMarkdowndocument, use topic parameters carefully, because these charts mayinterfere with each other.
The default theme issandsignika. There are other eighttheme you can choose:darkgreen/darkblue/avocado/darkunica/gray/gridlight/grid/sunset:
library(manipulateWidget)combineWidgets(sankeywheel(from = sankeydf$from,to = sankeydf$to,weight = sankeydf$weight,type ="sankey",width ="100%",theme ="sunset",title ="SUNSET"),sankeywheel(from = sankeydf$from,to = sankeydf$to,weight = sankeydf$weight,type ="dependencywheel",width ="100%",theme ="sunset",title ="SUNSET"),byrow =TRUE,ncol =2,width ="100%",height ="300px")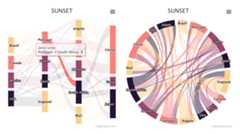
Other parameters
Here is a complete example:
sankeywheel(from = sankeydf$from,to = sankeydf$to,weight = sankeydf$weight,type ="dependencywheel",seriesName ="Random data: ",width ="100%",height ="400px",theme ="sunset",title ="SUNSET",titleAlign ="center",titleSize ="18px",titleColor ="black",subtitle ="czxa.top",subtitleAlign ="center",subtitleSize ="14px",subtitleColor ="black")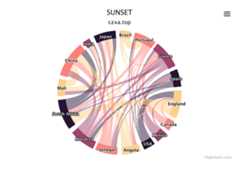
Use it in ‘RMarkdown’ and‘Shiny’ Apps
Here is a very simple ‘shiny’ example:
dir<-system.file("examples","sankeywheel",package ="sankeywheel")setwd(dir)shiny::shinyAppDir(".")Licence
sankeywheel has a dependency on Highcharts, a commercial JavaScriptcharting library. Highcharts offers both a commercial license as well asa free non-commercial license. Please review the licensing options andterms before using this software, as the sankeywheel license neitherprovides nor implies a license for Highcharts.
Highcharts (http://highcharts.com) is a Highsoft product which is notfree for commercial and Governmental use.
Acknowledgements
License
MIT © czxa.top
[8]ページ先頭