


Visualize simple 2-D decision tree partitions in R. Theparttree package provides visualization methods forboth base R graphics (viatinyplot)andggplot2.
The stable version ofparttree is available onCRAN.
install.packages("parttree")Or, you can grab the latest development version fromR-universe.
install.packages("parttree",repos ="https://grantmcdermott.r-universe.dev")Theparttreehomepageincludes an introductory vignette and detailed documentation. But here’sa quickstart example using the“kyphosis”dataset that comes bundled with therpart package. Inthis case, we are interested in predicting kyphosis recovery afterspinal surgery, as a function of 1) the number of topmost vertebra thatwere operated, and 2) patient age.
The key function isparttree(), which comes with its ownplotting method.
library(rpart)# For the dataset and fitting decisions treeslibrary(parttree)# This packagefit=rpart(Kyphosis~ Start+ Age,data = kyphosis)# Grab the partitions and plotfit_pt=parttree(fit)plot(fit_pt)
Customize your plots by passing additional arguments:
plot( fit_pt,border =NA,# no partition borderspch =19,# filled pointsalpha =0.6,# point transparencygrid =TRUE,# background gridpalette ="classic",# new colour palettexlab ="Topmost vertebra operated on",# custom x titleylab ="Patient age (months)",# custom y titlemain ="Tree predictions: Kyphosis recurrence"# custom title)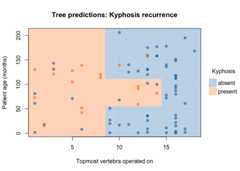
Forggplot2 users, we offer an equivalent workflowvia thegeom_partree() visualization layer.
library(ggplot2)## Should be loaded separatelyggplot(kyphosis,aes(x = Start,y = Age))+geom_parttree(data = fit,alpha =0.1,aes(fill = Kyphosis))+# <-- key layergeom_point(aes(col = Kyphosis))+labs(x ="No. of topmost vertebra operated on",y ="Patient age (months)",caption ="Note: Points denote observations. Shading denotes model predictions." )+theme_minimal()