| Type: | Package |
| Title: | Extending 'gt' for Beautiful HTML Tables |
| Version: | 0.6.1 |
| Description: | Provides additional functions for creating beautiful tables with 'gt'. The functions are generally wrappers around boilerplate or adding opinionated niche capabilities and helpers functions. |
| License: | MIT + file LICENSE |
| URL: | https://github.com/jthomasmock/gtExtras,https://jthomasmock.github.io/gtExtras/ |
| BugReports: | https://github.com/jthomasmock/gtExtras/issues |
| Depends: | R (≥ 3.6.0), gt (≥ 0.9.0) |
| Imports: | commonmark, dplyr (≥ 1.0.9), fontawesome (≥ 0.4.0), ggplot2(≥ 3.4.0), glue (≥ 1.6.1), htmltools (≥ 0.5.3), paletteer(≥ 1.4.0), rlang (≥ 1.0.4), scales (≥ 1.2.0), knitr (≥1.35), cli (≥ 3.6.0) |
| Suggests: | base64enc (≥ 0.1-3), bitops (≥ 1.0.6), covr, fs (≥ 1.5.2),hms, magrittr (≥ 1.5), rvest (≥ 1.0.3), sass (≥ 0.1.1),stringr (≥ 1.3.1), svglite (≥ 2.1.0), testthat (≥ 3.0.0),tibble (≥ 3.0.0), tidyr (≥ 1.0.0), tidyselect (≥ 1.0.0),webshot2 (≥ 0.1.0), xml2 (≥ 1.3.3), lifecycle (≥ 1.0.0) |
| Encoding: | UTF-8 |
| RoxygenNote: | 7.3.2 |
| Config/testthat/edition: | 3 |
| Config/testthat/parallel: | true |
| NeedsCompilation: | no |
| Packaged: | 2025-10-09 19:46:12 UTC; thomasmock |
| Author: | Thomas Mock [aut, cre, cph], Daniel D. Sjoberg [ctb] [ctb] |
| Maintainer: | Thomas Mock <j.thomasmock@gmail.com> |
| Repository: | CRAN |
| Date/Publication: | 2025-10-10 05:30:15 UTC |
gtExtras: Extending 'gt' for Beautiful HTML Tables
Description

Provides additional functions for creating beautiful tables with 'gt'. The functions are generally wrappers around boilerplate or adding opinionated niche capabilities and helpers functions.
Author(s)
Maintainer: Thomas Mockj.thomasmock@gmail.com [copyright holder]
Other contributors:
Daniel D. Sjobergdanield.sjoberg@gmail.com (ORCID) [contributor]
See Also
Useful links:
Report bugs athttps://github.com/jthomasmock/gtExtras/issues
Add badge color
Description
Add badge color
Usage
add_badge_color(add_color, add_label, alpha_lvl)Arguments
add_color | A color to add to the badge |
add_label | The label to add to the badge |
alpha_lvl | The alpha level |
Value
HTML character
Create a dot plot from 0 to 100
Description
Create a dot plot from 0 to 100
Usage
add_pcttile_plot(data, palette, add_label, width)Arguments
data | The single value that will be used to plot the point. |
palette | A length 3 palette, used to highlight high/med/low |
add_label | A logical indicating whether to add the label or note. This will only be added if it is the first or last row. |
width | A numeric indicating the |
Value
gt table
Create a dot plot from any range - add_point_plot
Description
Create a dot plot from any range - add_point_plot
Usage
add_point_plot(data, palette, add_label, width, vals_range, accuracy)Arguments
data | The single value that will be used to plot the point. |
palette | A length 3 palette, used to highlight high/med/low |
add_label | A logical indicating whether to add the label or note. This will only be added if it is the first or last row. |
width | A numeric indicating the |
vals_range | vector of length two indicating range |
accuracy | A number to round to. Use (e.g.) Applied to rescaled data. |
Value
gt table
Add text and an image to the left or right of it
Description
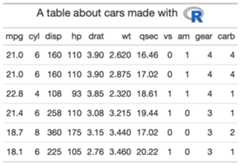
Theadd_text_img function takes an existinggt_tbl object andadds some user specified text and an image url to a specific cell. This is awrapper raw HTML strings andgt::web_image(). Intended to be used insidethe header of a table viagt::tab_header().
Usage
add_text_img(text, url, height = 30, left = FALSE)Arguments
text | A text string to be added to the cell. |
url | An image URL
A url that resolves to an image file. |
height | Height of image
The absolute height of the image in the table cell (in |
left | A logical TRUE/FALSE indicating if text should be on the left (TRUE) or right (FALSE) |
Value
An object of classgt_tbl.
Function ID
2-5
Figures
See Also
Other Utilities:fa_icon_repeat(),fmt_pad_num(),fmt_pct_extra(),fmt_symbol_first(),generate_df(),gt_add_divider(),gt_badge(),gt_double_table(),gt_duplicate_column(),gt_fa_rank_change(),gt_fa_rating(),gt_highlight_cols(),gt_highlight_rows(),gt_img_border(),gt_img_circle(),gt_img_multi_rows(),gt_img_rows(),gt_index(),gt_merge_stack(),gt_merge_stack_color(),gt_two_column_layout(),gtsave_extra(),img_header(),pad_fn(),tab_style_by_grp()
Examples
library(gt)title_car <- mtcars %>% head() %>% gt() %>% gt::tab_header( title = add_text_img( "A table about cars made with", url = "https://www.r-project.org/logo/Rlogo.png" ) )Create a summary table from a dataframe
Description
Create a summary table from a dataframe
Usage
create_sum_table(df)Arguments
df | a dataframe or tibble |
Value
A summary dataframe as a tibble
Examples
## Not run: create_sum_table(iris)#> # A tibble: 5 × 7#> type name value n_missing Mean Median SD#> <chr> <chr> <list> <dbl> <dbl> <dbl> <dbl>#> 1 numeric Sepal.Length <dbl [150]> 0 5.84 5.8 0.828#> 2 numeric Sepal.Width <dbl [150]> 0 3.06 3 0.436#> 3 numeric Petal.Length <dbl [150]> 0 3.76 4.35 1.77#> 4 numeric Petal.Width <dbl [150]> 0 1.20 1.3 0.762#> 5 factor Species <fct [150]> 0 NA NA NA## End(Not run)Repeat{fontawesome} icons and convert to HTML
Description
Thefa_icon_repeat function takes anfontawesome icon and repeats itn times.
Usage
fa_icon_repeat( name = "star", repeats = 1, fill = NULL, fill_opacity = NULL, stroke = NULL, stroke_width = NULL, stroke_opacity = NULL, height = NULL, width = NULL, margin_left = NULL, margin_right = NULL, position = NULL, title = NULL, a11y = c("deco", "sem", "none"))Arguments
name | The name of the Font Awesome icon. This could be as a short name (e.g., "npm", "drum", etc.), or, a full name (e.g., "fab fa-npm", "fas fa-drum", etc.). The names should correspond to current Version 5 Font Awesome names. A list of short and full names can be accessed through the fa_metadata() function with fa_metadata()$icon_names and fa_metadata()$icon_names_full. If supplying a Version 4 icon name, it will be internally translated to the Version 5 icon name and a Version 5 icon will be returned. A data frame containing the short names that changed from version 4 (v4_name) to version 5 (v5_name) can be obtained by using fa_metadata()$v4_v5_name_tbl. |
repeats | An integer indicating the number of repeats for that specific icon/row. |
fill,fill_opacity | The fill color of the icon can be set with fill. If not provided then the default value of "currentColor" is applied so that the SVG fill matches the color of the parent HTML element's color attribute. The opacity level of the SVG fill can be controlled with a decimal value between 0 and 1. |
stroke,stroke_width,stroke_opacity | The stroke options allow for setting the color, width, and opacity of the SVG outline stroke. By default, the stroke width is very small at "1px" so a size adjustment with "stroke_width" can be useful. The "stroke_opacity" value can be any decimal values between 0 and 1 (bounds included). |
height,width | The height and width style attributes of the rendered SVG. If nothing is provided for height then a default value of "1em" will be applied. If a width isn't given, then it will be calculated in units of "em" on the basis of the icon's SVG "viewBox" dimensions. |
margin_left,margin_right | The length value for the margin that's either left or right of the icon. By default, "auto" is used for both properties. If space is needed on either side then a length of "0.2em" is recommended as a starting point. |
position | The value for the position style attribute. By default, "relative" is used here. |
title | An option for populating the SVG 'title' attribute, which provides on-hover text for the icon. By default, no title text is given to the icon. If a11y == "semantic" then title text will be automatically given to the rendered icon, however, providing text here will override that. |
a11y | Cases that distinguish the role of the icon and inform which accessibility attributes to be used. Icons can either be "deco" (decorative, the default case) or "sem" (semantic). Using "none" will result in no accessibility features for the icon. |
Value
A character string of class HTML, representing repeated SVG logos
Function ID
2-4
See Also
Other Utilities:add_text_img(),fmt_pad_num(),fmt_pct_extra(),fmt_symbol_first(),generate_df(),gt_add_divider(),gt_badge(),gt_double_table(),gt_duplicate_column(),gt_fa_rank_change(),gt_fa_rating(),gt_highlight_cols(),gt_highlight_rows(),gt_img_border(),gt_img_circle(),gt_img_multi_rows(),gt_img_rows(),gt_index(),gt_merge_stack(),gt_merge_stack_color(),gt_two_column_layout(),gtsave_extra(),img_header(),pad_fn(),tab_style_by_grp()
Format numeric columns to align at decimal point without trailing zeroes
Description
This function removes repeating trailing zeroes and adds blank white spaceto align at the decimal point.
Usage
fmt_pad_num(gt_object, columns, sep = ".", nsmall = 2, pad0 = FALSE)Arguments
gt_object | An existing gt table object of class |
columns | The columns to format. Can either be a series of column names provided in |
sep | A character for the separator, typically |
nsmall | The max number of decimal places to round at/display |
pad0 | A logical, indicating whether to pad the values with trailing zeros. |
Value
An object of classgt_tbl.
Figures

Function ID
2-2
See Also
Other Utilities:add_text_img(),fa_icon_repeat(),fmt_pct_extra(),fmt_symbol_first(),generate_df(),gt_add_divider(),gt_badge(),gt_double_table(),gt_duplicate_column(),gt_fa_rank_change(),gt_fa_rating(),gt_highlight_cols(),gt_highlight_rows(),gt_img_border(),gt_img_circle(),gt_img_multi_rows(),gt_img_rows(),gt_index(),gt_merge_stack(),gt_merge_stack_color(),gt_two_column_layout(),gtsave_extra(),img_header(),pad_fn(),tab_style_by_grp()
Examples
library(gt)padded_tab <- data.frame(numbers = c(1.2345, 12.345, 123.45, 1234.5, 12345)) %>% gt() %>% fmt_pad_num(columns = numbers, nsmall = 4)Convert to percent and show less than 1% as <1% in grey
Description
Convert to percent and show less than 1% as <1% in grey
Usage
fmt_pct_extra(gt_object, columns, ..., scale = 1)Arguments
gt_object | An existing gt table |
columns | The columns to affect |
... | Additional argument passed to |
scale | A number to multiply values by, defaults to 1 |
Value
a gt table
See Also
Other Utilities:add_text_img(),fa_icon_repeat(),fmt_pad_num(),fmt_symbol_first(),generate_df(),gt_add_divider(),gt_badge(),gt_double_table(),gt_duplicate_column(),gt_fa_rank_change(),gt_fa_rating(),gt_highlight_cols(),gt_highlight_rows(),gt_img_border(),gt_img_circle(),gt_img_multi_rows(),gt_img_rows(),gt_index(),gt_merge_stack(),gt_merge_stack_color(),gt_two_column_layout(),gtsave_extra(),img_header(),pad_fn(),tab_style_by_grp()
Examples
library(gt)pct_tab <- dplyr::tibble(x = c(.001, .05, .008, .1, .2, .5, .9)) %>% gt::gt() %>% fmt_pct_extra(x, scale = 100, accuracy = .1)Aligning first-row text only
Description
This is an experimental function that allows you to apply a suffix/symbolto only the first row of a table, and maintain the alignment with whitespacein the remaining rows.
Usage
fmt_symbol_first( gt_object, column = NULL, symbol = NULL, suffix = "", decimals = NULL, last_row_n = NULL, symbol_first = FALSE, scale_by = NULL, gfont = NULL)Arguments
gt_object | An existing gt table object of class |
column | columns to apply color to with tidyeval |
symbol | The HTML code or raw character string of the symbol being inserted, optionally |
suffix | a suffix to add, optionally |
decimals | the number of decimal places to round to |
last_row_n | Defining the last row to apply this to. The function will attempt to guess the proper length, but you can always hardcode a specific length. |
symbol_first | TRUE/FALSE - symbol before after suffix. |
scale_by | A numeric value to multiply the values by. Useful for scaling percentages from 0 to 1 to 0 to 100. |
gfont | A string passed to |
Value
An object of classgt_tbl.
Figures

Function ID
2-1
See Also
Other Utilities:add_text_img(),fa_icon_repeat(),fmt_pad_num(),fmt_pct_extra(),generate_df(),gt_add_divider(),gt_badge(),gt_double_table(),gt_duplicate_column(),gt_fa_rank_change(),gt_fa_rating(),gt_highlight_cols(),gt_highlight_rows(),gt_img_border(),gt_img_circle(),gt_img_multi_rows(),gt_img_rows(),gt_index(),gt_merge_stack(),gt_merge_stack_color(),gt_two_column_layout(),gtsave_extra(),img_header(),pad_fn(),tab_style_by_grp()
Examples
library(gt)fmted_tab <- gtcars %>% head() %>% dplyr::select(mfr, year, bdy_style, mpg_h, hp) %>% dplyr::mutate(mpg_h = rnorm(n = dplyr::n(), mean = 22, sd = 1)) %>% gt::gt() %>% gt::opt_table_lines() %>% fmt_symbol_first(column = mfr, symbol = "$", last_row_n = 6) %>% fmt_symbol_first(column = year, suffix = "%") %>% fmt_symbol_first(column = mpg_h, symbol = "%", decimals = 1) %>% fmt_symbol_first(hp, symbol = "°", suffix = "F", symbol_first = TRUE)Generate pseudorandom dataframes with specific parameters
Description
This function is a small utility to create a specific length dataframewith a set number of groups, specific mean/sd per group. Note that the total lengthof the dataframe will ben *n_grps.
Usage
generate_df(n = 10L, n_grps = 1L, mean = c(10), sd = mean/10, with_seed = NULL)Arguments
n | An integer indicating the number of rows per group, default to |
n_grps | An integer indicating the number of rows per group, defaults to |
mean | A number indicating the mean of the randomly generated values, must be a vector of equal length to the |
sd | A number indicating the standard deviation of the randomly generated values, must be a vector of equal length to the |
with_seed | A seed to make the randomization reproducible |
Value
a tibble/dataframe
Function ID
2-19
See Also
Other Utilities:add_text_img(),fa_icon_repeat(),fmt_pad_num(),fmt_pct_extra(),fmt_symbol_first(),gt_add_divider(),gt_badge(),gt_double_table(),gt_duplicate_column(),gt_fa_rank_change(),gt_fa_rating(),gt_highlight_cols(),gt_highlight_rows(),gt_img_border(),gt_img_circle(),gt_img_multi_rows(),gt_img_rows(),gt_index(),gt_merge_stack(),gt_merge_stack_color(),gt_two_column_layout(),gtsave_extra(),img_header(),pad_fn(),tab_style_by_grp()
Examples
library(dplyr)generate_df( 100L, n_grps = 5, mean = seq(10, 50, length.out = 5)) %>% group_by(grp) %>% summarise( mean = mean(values), # mean is approx mean sd = sd(values), # sd is approx sd n = n(), # each grp is of length n # showing that the sd default of mean/10 works `mean/sd` = round(mean / sd, 1) )Get underlying row index for gt tables
Description
Provides underlying row index for grouped or ungroupedgt tables. In some cases the visual representation of specific rows isinconsistent with the "row number" so this function provides the finaloutput index for subsetting or targetting rows.
Usage
get_row_index(gt_object)Arguments
gt_object | an existing gt table |
Value
a vector of row indices
Examples
Create a helper function
This helper functions lets us be a bit more efficient when showing the rownumbers/colors.
library(gt)row_sty <- function(tab, row){ OkabeIto <- c("#E69F00", "#56B4E9", "#009E73", "#F0E442", "#0072B2", "#D55E00", "#CC79A7", "#999999") tab %>% tab_style( cell_fill(color = OkabeIto[row]), locations = cells_body(rows = row) )}Randomize the data
We will randomly sample the data to get it in a specific order.
set.seed(37)df <- mtcars %>% dplyr::group_by(cyl) %>% dplyr::slice_sample(n = 2) %>% dplyr::ungroup() %>% dplyr::slice_sample(n = 6) %>% dplyr::mutate(row_id = dplyr::row_number(), .before = 1)#> df#> A tibble: 6 × 12#> row_id mpg cyl disp hp drat wt qsec vs am gear carb#> <int> <dbl> <dbl> <dbl> <dbl> <dbl> <dbl> <dbl> <dbl> <dbl> <dbl> <dbl>#> 1 10.4 8 472 205 2.93 5.25 18.0 0 0 3 4#> 2 18.1 6 225 105 2.76 3.46 20.2 1 0 3 1#> 3 21.4 6 258 110 3.08 3.22 19.4 1 0 3 1#> 4 13.3 8 350 245 3.73 3.84 15.4 0 0 3 4#> 5 33.9 4 71.1 65 4.22 1.84 19.9 1 1 4 1#> 6 22.8 4 108 93 3.85 2.32 18.6 1 1 4 1
Ungrouped data
Ungrouped data works just fine, and the row indices are identical betweenthe visual representation and the output.
gt(df) %>% row_sty(1) %>% row_sty(3) %>% row_sty(5)

Grouped data
However, for grouped data, the row indices are representative of the underlyingdata before grouping, leading to some potential confusion.
tab2 <- gt(df, groupname_col = "cyl")tab2 %>% row_sty(1) %>% ## actually row 1 row_sty(3) %>% ## actually row 5 row_sty(5) ## actually row 2

Theget_row_index() function gives ability to create an index of the finaloutput, so you can reference specific rows by number.
tab_index <- get_row_index(tab2)tab2 %>% row_sty(4) %>% ## wrong row, actually row 6 visually row_sty(tab_index[4]) ## correct row, actually row 4

tab2 %>% row_sty(tab_index[1]) %>% row_sty(tab_index[3]) %>% row_sty(tab_index[5])

Add a dividing border to an existinggt table.
Description
Thegt_add_divider function takes an existinggt_tbl object andadds borders or dividers to specific columns.
Usage
gt_add_divider( gt_object, columns, sides = "right", color = "grey", style = "solid", weight = px(2), include_labels = TRUE)Arguments
gt_object | An existing gt table object of class |
columns | Specific columns to apply color to, accepts either |
sides | The border sides to be modified. Options include |
color,style,weight | The border color, style, and weight. The |
include_labels | A logical, either |
Value
An object of classgt_tbl.
Examples
library(gt)basic_divider <- head(mtcars) %>% gt() %>% gt_add_divider(columns = "cyl", style = "dashed")
Figures

Function ID
2-11
See Also
Other Utilities:add_text_img(),fa_icon_repeat(),fmt_pad_num(),fmt_pct_extra(),fmt_symbol_first(),generate_df(),gt_badge(),gt_double_table(),gt_duplicate_column(),gt_fa_rank_change(),gt_fa_rating(),gt_highlight_cols(),gt_highlight_rows(),gt_img_border(),gt_img_circle(),gt_img_multi_rows(),gt_img_rows(),gt_index(),gt_merge_stack(),gt_merge_stack_color(),gt_two_column_layout(),gtsave_extra(),img_header(),pad_fn(),tab_style_by_grp()
Insert an alert icon to a specific column
Description
Insert an alert icon to a specific column
Usage
gt_alert_icon( gt_object, column, palette = c("#a962b6", "#f1f1f1", "#378e38"), domain = NULL, height = "10px", direction = 1, align = "center", v_pad = -5)Arguments
gt_object | An existing gt table object of class |
column | The column wherein the numeric values should be replaced with circular alert icons. |
palette | The colours or colour function that values will be mapped to. Can be a character vector (eg |
domain | The possible values that can be mapped. This should be a simple numeric range (e.g. |
height | A character string indicating the height in pixels, like "10px" |
direction | The direction of the |
align | Character string indicating alignment of the column, defaults to "left" |
v_pad | A numeric value indicating the vertical padding, defaults to -5 to aid in centering within the vertical space. |
Value
a gt table
Examples
head(mtcars) %>% dplyr::mutate(warn = ifelse(mpg >= 21, 1, 0), .before = mpg) %>% gt::gt() %>% gt_alert_icon(warn)
![]()
Add a 'badge' based on values and palette
Description
Add a 'badge' based on values and palette
Usage
gt_badge( gt_object, column, palette = NULL, alpha = 0.2, rows = gt::everything())Arguments
gt_object | An existing |
column | The column to convert to badges, accepts |
palette | Name of palette as a string. Must be either length of 1 or a vector of valid color names/hex values of equal length to the unique levels of the column (ie if there are 4 names, there need to be 4x colors). Note that if you would like to specify a specific color to match a specific icon, you can also use a named vector like: |
alpha | A numeric indicating the alpha/transparency. Range from 0 to 1 |
rows | The rows to apply the badge to, accepts |
Value
gt table
Examples
library(gt)head(mtcars) %>% dplyr::mutate(cyl = paste(cyl, "Cyl")) %>% gt() %>% gt_badge(cyl, palette = c("4 Cyl"="red","6 Cyl"="blue","8 Cyl"="green"))Figures
![]()
See Also
Other Utilities:add_text_img(),fa_icon_repeat(),fmt_pad_num(),fmt_pct_extra(),fmt_symbol_first(),generate_df(),gt_add_divider(),gt_double_table(),gt_duplicate_column(),gt_fa_rank_change(),gt_fa_rating(),gt_highlight_cols(),gt_highlight_rows(),gt_img_border(),gt_img_circle(),gt_img_multi_rows(),gt_img_rows(),gt_index(),gt_merge_stack(),gt_merge_stack_color(),gt_two_column_layout(),gtsave_extra(),img_header(),pad_fn(),tab_style_by_grp()
Add a small color box relative to the cell value.
Description
CreatePFF-style colorboxes in agt table.Note that rather than usinggt::fmt_ functions on this column, you can sendnumeric formatting arguments via.... All arguments should be namedand are passed toscales::label_number().
Usage
gt_color_box( gt_object, columns, palette = NULL, ..., domain = NULL, width = 70, font_weight = "bold")Arguments
gt_object | An existing gt table object of class |
columns | The columns wherein changes to cell data colors should occur. |
palette | The colours or colour function that values will be mapped to. Can be a character vector (eg |
... | Additional arguments passed to |
domain | The possible values that can be mapped. This should be a simple numeric range (e.g. |
width | The width of the entire coloring area in pixels. |
font_weight | A string indicating the font weight, defaults to |
Value
An object of classgt_tbl.
Examples
library(gt)test_data <- dplyr::tibble(x = letters[1:10], y = seq(100, 10, by = -10), z = seq(10, 100, by = 10))color_box_tab <- test_data %>% gt() %>% gt_color_box(columns = y, domain = 0:100, palette = "ggsci::blue_material") %>% gt_color_box(columns = z, domain = 0:100, palette = c("purple", "lightgrey", "green"))Figures

Function ID
4-3
See Also
Other Colors:gt_color_rows(),gt_hulk_col_numeric()
Add scaled colors according to numeric values or categories/factors
Description
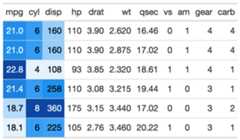
Thegt_color_rows function takes an existinggt_tbl object andapplies pre-existing palettes from the{paletteer} package or custompalettes defined by the user. This function is a custom wrapper aroundgt::data_color(), and uses some of the boilerplate code. Basic useis simpler thandata_color().
Usage
gt_color_rows( gt_object, columns, palette = "ggsci::red_material", direction = 1, domain = NULL, pal_type = c("discrete", "continuous"), ...)Arguments
gt_object | An existing gt table object of class |
columns | The columns wherein changes to cell data colors should occur. |
palette | The colours or colour function that values will be mapped to |
direction | Either |
domain | The possible values that can be mapped. For If |
pal_type | A string indicating the palette type (one of |
... | Additional arguments passed to |
Value
An object of classgt_tbl.
Examples
library(gt) # basic use basic_use <- mtcars %>% head(15) %>% gt() %>% gt_color_rows(mpg:disp) # change palette to one that paletteer recognizes change_pal <- mtcars %>% head(15) %>% gt() %>% gt_color_rows(mpg:disp, palette = "ggsci::blue_material") # change palette to raw values vector_pal <- mtcars %>% head(15) %>% gt() %>% gt_color_rows( mpg:disp, palette = c("white", "green")) # could also use palette = c("#ffffff", "##00FF00") # use discrete instead of continuous palette discrete_pal <- mtcars %>% head(15) %>% gt() %>% gt_color_rows( cyl, pal_type = "discrete", palette = "ggthemes::colorblind", domain = range(mtcars$cyl) ) # use discrete and manually define range range_pal <- mtcars %>% dplyr::select(gear, mpg:hp) %>% head(15) %>% gt() %>% gt_color_rows( gear, pal_type = "discrete", direction = -1, palette = "colorblindr::OkabeIto_black", domain = c(3,4,5))Figures


Function ID
4-2
See Also
Other Colors:gt_color_box(),gt_hulk_col_numeric()
Take data, a gt-generating function, and create a list of two tables
Description
Thegt_double_table function takes some data and a user-suppliedfunction to generate two tables in a list. To convert existinggt::gt()code to a function, you can follow the approximate pattern:gt_fn <- function(x){gt(x) %>% more_gt_code}
Your function should only have asingle argument, which is thedatato be supplied directly into thegt::gt() function. This function isintended to be passed directly intogt_two_column_layout(), for printingit to the viewer, saving it to a.png, or returning the raw HTML.
Usage
gt_double_table(data, gt_fn, nrows = NULL, noisy = TRUE)Arguments
data | A |
gt_fn | A user-defined function that has one argument, this argument should pass data to the |
nrows | The number of rows to split at, defaults to |
noisy | A logical indicating whether to return the warning about not supplying |
Value
alist() of twogt tables
Examples
library(gt)# define your own functionmy_gt_function <- function(x) { gt(x) %>% gtExtras::gt_color_rows(columns = mpg, domain = range(mtcars$mpg)) %>% tab_options(data_row.padding = px(3))}two_tables <- gt_double_table(mtcars, my_gt_function, nrows = 16)# list of two gt_tbl objects# ready to pass to gtExtras::gt_two_column_layout()str(two_tables, max.level = 1)#> List of 2#> $ :List of 16#> ..- attr(*, "class")= chr [1:2] "gt_tbl" "list"#> $ :List of 16#> ..- attr(*, "class")= chr [1:2] "gt_tbl" "list"Function ID
2-13
See Also
Other Utilities:add_text_img(),fa_icon_repeat(),fmt_pad_num(),fmt_pct_extra(),fmt_symbol_first(),generate_df(),gt_add_divider(),gt_badge(),gt_duplicate_column(),gt_fa_rank_change(),gt_fa_rating(),gt_highlight_cols(),gt_highlight_rows(),gt_img_border(),gt_img_circle(),gt_img_multi_rows(),gt_img_rows(),gt_index(),gt_merge_stack(),gt_merge_stack_color(),gt_two_column_layout(),gtsave_extra(),img_header(),pad_fn(),tab_style_by_grp()
Duplicate an existing column in a gt table
Description
This function takes an existing gt table and will duplicate a column.You also have the option to specify where the column ends up, and what willbe appending to the end of the column name to differentiate it.
Usage
gt_duplicate_column( gt_object, column, after = dplyr::last_col(), append_text = "_dupe", dupe_name = NULL)Arguments
gt_object | An existing gt table object of class |
column | The column to be duplicated |
after | The column to place the duplicate column after |
append_text | The text to add to the column name to differentiate it from the original column name |
dupe_name | A full name for the "new" duplicated column, will override |
Value
An object of classgt_tbl.
Function ID
2-15
See Also
Other Utilities:add_text_img(),fa_icon_repeat(),fmt_pad_num(),fmt_pct_extra(),fmt_symbol_first(),generate_df(),gt_add_divider(),gt_badge(),gt_double_table(),gt_fa_rank_change(),gt_fa_rating(),gt_highlight_cols(),gt_highlight_rows(),gt_img_border(),gt_img_circle(),gt_img_multi_rows(),gt_img_rows(),gt_index(),gt_merge_stack(),gt_merge_stack_color(),gt_two_column_layout(),gtsave_extra(),img_header(),pad_fn(),tab_style_by_grp()
Examples
library(gt)dupe_table <- head(mtcars) %>% dplyr::select(mpg, disp) %>% gt() %>% gt_duplicate_column(mpg, after = disp, append_text = "2")Add rank change indicators to a gt table
Description
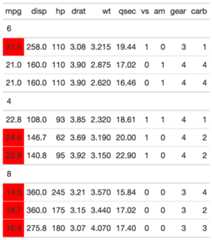
Takes an existinggt table and converts a column of integersinto various types of up/down arrows. Note that you need to specify a paletteof three colors, in the order of up, neutral, down. Defaults to green, grey,purple. There are 6 supportedfa_type, representing various arrows.Note that you can usefont_color = 'match' to match the palette acrossarrows and text.show_text = FALSE will remove the text from the column,resulting only in colored arrows.
Usage
gt_fa_rank_change( gt_object, column, palette = c("#1b7837", "lightgrey", "#762a83"), fa_type = c("angles", "arrow", "turn", "chevron", "caret"), font_color = "black", show_text = TRUE)Arguments
gt_object | An existing |
column | The single column that you would like to convert to rank change indicators. |
palette | A character vector of length 3. Colors can be represented as hex values or named colors. Colors should be in the order of up-arrow, no-change, down-arrow, defaults to green, grey, purple. |
fa_type | The name of the Fontawesome icon, limited to 5 types of various arrows, one of |
font_color | A string, indicating the color of the font, can also be returned as |
show_text | A logical indicating whether to show/hide the values in the column. |
Value
agt table
Examples
rank_table <- dplyr::tibble(x = c(1:3, -1, -2, -5, 0)) %>% gt::gt() %>% gt_fa_rank_change(x, font_color = "match")
Figures
![]()
See Also
Other Utilities:add_text_img(),fa_icon_repeat(),fmt_pad_num(),fmt_pct_extra(),fmt_symbol_first(),generate_df(),gt_add_divider(),gt_badge(),gt_double_table(),gt_duplicate_column(),gt_fa_rating(),gt_highlight_cols(),gt_highlight_rows(),gt_img_border(),gt_img_circle(),gt_img_multi_rows(),gt_img_rows(),gt_index(),gt_merge_stack(),gt_merge_stack_color(),gt_two_column_layout(),gtsave_extra(),img_header(),pad_fn(),tab_style_by_grp()
Add rating "stars" to a gt column
Description
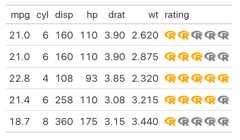
Add rating "stars" to a gt column
Usage
gt_fa_rating( gt_object, column, max_rating = 5, ..., color = "orange", icon = "star")Arguments
gt_object | An existing gt table object of class |
column | The column wherein the numeric values should be replaced with their corresponding |
max_rating | The max number of icons to add, these will be added in grey to indicate "missing" |
... | Additional arguments passed to |
color | The color of the icon, accepts named colors ( |
icon | The icon name, passed to |
Value
An object of classgt_tbl.
Examples
library(gt)set.seed(37)rating_table <- mtcars %>% dplyr::select(mpg:wt) %>% dplyr::slice(1:5) %>% dplyr::mutate(rating = sample(1:5, size = 5, TRUE)) %>% gt() %>% gt_fa_rating(rating, icon = "r-project")
Figures
Function ID
2-16
See Also
Other Utilities:add_text_img(),fa_icon_repeat(),fmt_pad_num(),fmt_pct_extra(),fmt_symbol_first(),generate_df(),gt_add_divider(),gt_badge(),gt_double_table(),gt_duplicate_column(),gt_fa_rank_change(),gt_highlight_cols(),gt_highlight_rows(),gt_img_border(),gt_img_circle(),gt_img_multi_rows(),gt_img_rows(),gt_index(),gt_merge_stack(),gt_merge_stack_color(),gt_two_column_layout(),gtsave_extra(),img_header(),pad_fn(),tab_style_by_grp()
Add color highlighting to a specific column(s)
Description
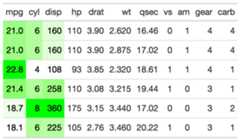
Thegt_highlight_cols function takes an existinggt_tbl object andadds highlighting color to the cell background of a specific column(s).
Usage
gt_highlight_cols( gt_object, columns, fill = "#80bcd8", alpha = 1, font_weight = "normal", font_color = "#000000")Arguments
gt_object | An existing gt table object of class |
columns | Specific columns to apply color to, accepts either |
fill | A character string indicating the fill color. If nothing is provided, then "#80bcd8" (light blue) will be used as a default. |
alpha | An optional alpha transparency value for the color as single value in the range of 0 (fully transparent) to 1 (fully opaque). If not provided the fill color will either be fully opaque or use alpha information from the color value if it is supplied in the #RRGGBBAA format. |
font_weight | A string or number indicating the weight of the font. Can be a text-based keyword such as "normal", "bold", "lighter", "bolder", or, a numeric value between 1 and 1000, inclusive. Note that only variable fonts may support the numeric mapping of weight. |
font_color | A character string indicating the text color. If nothing is provided, then "#000000" (black) will be used as a default. |
Value
An object of classgt_tbl.
Examples
library(gt)basic_col <- head(mtcars) %>% gt() %>% gt_highlight_cols(cyl, fill = "red", alpha = 0.5)
Figures

Function ID
2-9
See Also
Other Utilities:add_text_img(),fa_icon_repeat(),fmt_pad_num(),fmt_pct_extra(),fmt_symbol_first(),generate_df(),gt_add_divider(),gt_badge(),gt_double_table(),gt_duplicate_column(),gt_fa_rank_change(),gt_fa_rating(),gt_highlight_rows(),gt_img_border(),gt_img_circle(),gt_img_multi_rows(),gt_img_rows(),gt_index(),gt_merge_stack(),gt_merge_stack_color(),gt_two_column_layout(),gtsave_extra(),img_header(),pad_fn(),tab_style_by_grp()
Add color highlighting to a specific row
Description
Thegt_highlight_rows function takes an existinggt_tbl object andadds highlighting color to the cell background of a specific row. The functionaccepts rows only by number (not by logical expression) for now.
Usage
gt_highlight_rows( gt_object, columns = gt::everything(), rows = TRUE, fill = "#80bcd8", alpha = 0.8, font_weight = "bold", font_color = "#000000", bold_target_only = FALSE, target_col = c())Arguments
gt_object | An existing gt table object of class |
columns | Specific columns to apply color to, accepts either |
rows | The rows to apply the highlight to. Can either by a |
fill | A character string indicating the fill color. If nothing is provided, then "#80bcd8" (light blue) will be used as a default. |
alpha | An optional alpha transparency value for the color as single value in the range of 0 (fully transparent) to 1 (fully opaque). If not provided the fill color will either be fully opaque or use alpha information from the color value if it is supplied in the #RRGGBBAA format. |
font_weight | A string or number indicating the weight of the font. Can be a text-based keyword such as "normal", "bold", "lighter", "bolder", or, a numeric value between 1 and 1000, inclusive. Note that only variable fonts may support the numeric mapping of weight. |
font_color | A character string indicating the text color. If nothing is provided, then "#000000" (black) will be used as a default. |
bold_target_only | A logical of TRUE/FALSE indicating whether to apply bold to only the specific |
target_col | A specific |
Value
An object of classgt_tbl.
Examples
library(gt)basic_use <- head(mtcars[,1:5]) %>% tibble::rownames_to_column("car") %>% gt() %>% gt_highlight_rows(rows = 2, font_weight = "normal")target_bold_column <- head(mtcars[,1:5]) %>% tibble::rownames_to_column("car") %>% gt() %>% gt_highlight_rows( rows = 5, fill = "lightgrey", bold_target_only = TRUE, target_col = car )Figures


Function ID
2-10
See Also
Other Utilities:add_text_img(),fa_icon_repeat(),fmt_pad_num(),fmt_pct_extra(),fmt_symbol_first(),generate_df(),gt_add_divider(),gt_badge(),gt_double_table(),gt_duplicate_column(),gt_fa_rank_change(),gt_fa_rating(),gt_highlight_cols(),gt_img_border(),gt_img_circle(),gt_img_multi_rows(),gt_img_rows(),gt_index(),gt_merge_stack(),gt_merge_stack_color(),gt_two_column_layout(),gtsave_extra(),img_header(),pad_fn(),tab_style_by_grp()
Apply 'hulk' palette to specific columns in a gt table.
Description
The hulk name comes from the idea of a diverging purple and green themethat is colorblind safe and visually appealing.It is a useful alternative to the red/green palette where purple typicallycan indicate low or "bad" value, and green can indicate a high or "good" value.
Usage
gt_hulk_col_numeric( gt_object, columns = NULL, domain = NULL, ..., trim = FALSE)Arguments
gt_object | An existing gt table object of class |
columns | The columns wherein changes to cell data colors should occur. |
domain | The possible values that can be mapped. For If |
... | Additional arguments passed to |
trim | trim the palette to give less intense maximal colors |
Value
An object of classgt_tbl.
Examples
library(gt) # basic use hulk_basic <- mtcars %>% head() %>% gt::gt() %>% gt_hulk_col_numeric(mpg) hulk_trim <- mtcars %>% head() %>% gt::gt() %>% # trim gives small range of colors gt_hulk_col_numeric(mpg:disp, trim = TRUE) # option to reverse the color palette hulk_rev <- mtcars %>% head() %>% gt::gt() %>% # trim gives small range of colors gt_hulk_col_numeric(mpg:disp, reverse = TRUE)
Figures


Function ID
4-1
See Also
Other Colors:gt_color_box(),gt_color_rows()
Add a basic hyperlink in a gt table
Description
A lightweight helper to add a hyperlink, can be used throughoutagt table.
Usage
gt_hyperlink(text, url)Arguments
text | The text displayed for the hyperlink |
url | The url for the hyperlink |
Value
HTML text
Create an identifier line border at the bottom of an image
Description
Create an identifier line border at the bottom of an image
Usage
gt_img_border( gt_object, column, height = 25, width = 25, border_color = "black", border_weight = 2.5)Arguments
gt_object | An existing gt object |
column | The column to apply the transformation to |
height | A number indicating the height of the image in pixels. |
width | A number indicating the width of the image in pixels. |
border_color | The color of the circular border, can either be a single value ie ( |
border_weight | A number indicating the weight of the border in pixels. |
Value
a gt object
Examples
library(gt)gt_img_tab <- dplyr::tibble( x = 1:4, names = c("Waking Up", "Wiggling", "Sleep"," Glamour"), img = c( "https://pbs.twimg.com/media/EiIY-1fXgAEV6CJ?format=jpg&name=360x360", "https://pbs.twimg.com/media/EiIY-1fXcAIPdTS?format=jpg&name=360x360", "https://pbs.twimg.com/media/EiIY-1mX0AE-YkC?format=jpg&name=360x360", "https://pbs.twimg.com/media/EiIY-2cXYAA1VaO?format=jpg&name=360x360" )) %>% gt() %>% gt_img_border(img)Figures

See Also
Other Utilities:add_text_img(),fa_icon_repeat(),fmt_pad_num(),fmt_pct_extra(),fmt_symbol_first(),generate_df(),gt_add_divider(),gt_badge(),gt_double_table(),gt_duplicate_column(),gt_fa_rank_change(),gt_fa_rating(),gt_highlight_cols(),gt_highlight_rows(),gt_img_circle(),gt_img_multi_rows(),gt_img_rows(),gt_index(),gt_merge_stack(),gt_merge_stack_color(),gt_two_column_layout(),gtsave_extra(),img_header(),pad_fn(),tab_style_by_grp()
Create circular border around an image
Description
Create circular border around an image
Usage
gt_img_circle( gt_object, column, height = 25, border_color = "black", border_weight = 1.5)Arguments
gt_object | An existing gt object |
column | The column to apply the transformation to |
height | A number indicating the height of the image in pixels. |
border_color | The color of the circular border, can either be a single value ie ( |
border_weight | A number indicating the weight of the border in pixels. |
Value
a gt object
Examples
library(gt)gt_img_tab <- dplyr::tibble( x = 1:4, names = c("Rich Iannone", "Katie Masiello", "Tom Mock","Hadley Wickham"), img = c( "https://pbs.twimg.com/profile_images/961326215792533504/Ih6EsvtF_400x400.jpg", "https://pbs.twimg.com/profile_images/1471188460220260354/rHhoIXkZ_400x400.jpg", "https://pbs.twimg.com/profile_images/1467219661121064965/Lfondr9M_400x400.jpg", "https://pbs.twimg.com/profile_images/905186381995147264/7zKAG5sY_400x400.jpg" )) %>% gt() %>% gt_img_circle(img)Figures
Function ID
2-15
See Also
Other Utilities:add_text_img(),fa_icon_repeat(),fmt_pad_num(),fmt_pct_extra(),fmt_symbol_first(),generate_df(),gt_add_divider(),gt_badge(),gt_double_table(),gt_duplicate_column(),gt_fa_rank_change(),gt_fa_rating(),gt_highlight_cols(),gt_highlight_rows(),gt_img_border(),gt_img_multi_rows(),gt_img_rows(),gt_index(),gt_merge_stack(),gt_merge_stack_color(),gt_two_column_layout(),gtsave_extra(),img_header(),pad_fn(),tab_style_by_grp()
Add multiple local or web images into rows of agt table
Description
Thegt_multi_img_rows function takes an existinggt_tbl object andconverts nested cells with filenames or urls to images into inline images. This is a wrapperaroundgt::text_transform() +gt::web_image()/gt::local_image() withthe necessary boilerplate already applied.
Usage
gt_img_multi_rows(gt_object, columns, img_source = "web", height = 30)Arguments
gt_object | An existing gt table object of class |
columns | The columns wherein changes to cell data colors should occur. |
img_source | A string, specifying either "local" or "web" as the source of the images. |
height | Height of image
The absolute height of the image in the table cell (in |
Value
An object of classgt_tbl.
Examples
library(gt)teams <- "https://github.com/nflverse/nflfastR-data/raw/master/teams_colors_logos.rds"team_df <- readRDS(url(teams))conf_table <- team_df %>% dplyr::select(team_conf, team_division, logo = team_logo_espn) %>% dplyr::distinct() %>% tidyr::nest(data = logo) %>% dplyr::rename(team_logos = data) %>% dplyr::arrange(team_conf, team_division) %>% gt() %>% gt_img_multi_rows(columns = team_logos, height = 25)
Figures

Function ID
2-9
See Also
Other Utilities:add_text_img(),fa_icon_repeat(),fmt_pad_num(),fmt_pct_extra(),fmt_symbol_first(),generate_df(),gt_add_divider(),gt_badge(),gt_double_table(),gt_duplicate_column(),gt_fa_rank_change(),gt_fa_rating(),gt_highlight_cols(),gt_highlight_rows(),gt_img_border(),gt_img_circle(),gt_img_rows(),gt_index(),gt_merge_stack(),gt_merge_stack_color(),gt_two_column_layout(),gtsave_extra(),img_header(),pad_fn(),tab_style_by_grp()
Add local or web images into rows of agt table
Description
Thegt_img_rows function takes an existinggt_tbl object andconverts filenames or urls to images into inline images. This is a wrapperaroundgt::text_transform() +gt::web_image()/gt::local_image() withthe necessary boilerplate already applied.
Usage
gt_img_rows(gt_object, columns, img_source = "web", height = 30)Arguments
gt_object | An existing gt table object of class |
columns | The columns wherein changes to cell data colors should occur. |
img_source | A string, specifying either "local" or "web" as the source of the images. |
height | Height of image
The absolute height of the image in the table cell (in |
Value
An object of classgt_tbl.
Examples
library(gt)teams <- "https://github.com/nflverse/nflfastR-data/raw/master/teams_colors_logos.rds"team_df <- readRDS(url(teams)) logo_table <- team_df %>% dplyr::select(team_wordmark, team_abbr, logo = team_logo_espn, team_name:team_conf) %>% head() %>% gt() %>% gt_img_rows(columns = team_wordmark, height = 25) %>% gt_img_rows(columns = logo, img_source = "web", height = 30) %>% tab_options(data_row.padding = px(1))
Figures
Function ID
2-7
See Also
Other Utilities:add_text_img(),fa_icon_repeat(),fmt_pad_num(),fmt_pct_extra(),fmt_symbol_first(),generate_df(),gt_add_divider(),gt_badge(),gt_double_table(),gt_duplicate_column(),gt_fa_rank_change(),gt_fa_rating(),gt_highlight_cols(),gt_highlight_rows(),gt_img_border(),gt_img_circle(),gt_img_multi_rows(),gt_index(),gt_merge_stack(),gt_merge_stack_color(),gt_two_column_layout(),gtsave_extra(),img_header(),pad_fn(),tab_style_by_grp()
Return the underlying data, arranged by the internal index
Description
This is a utility function to extract the underlying data fromagt table. You can use it with a savedgt table, in the pipe (%>%)or even within most othergt functions (egtab_style()). It defaults toreturning the column indicated as a vector, so that you can work with thevalues. Typically this is used with logical statements to affect one columnbased on the values in that specified secondary column.Alternatively, you can extract the entire ordered data according to theinternal index as atibble. This allows for even more complex stepsbased on multiple indices.
Usage
gt_index(gt_object, column, as_vector = TRUE)Arguments
gt_object | An existing gt table object |
column | The column name that you intend to extract, accepts tidyeval semantics (ie |
as_vector | A logical indicating whether you'd like just the column indicated as a vector, or the entire dataframe |
Value
A vector or atibble
Figures
Function ID
2-20
See Also
Other Utilities:add_text_img(),fa_icon_repeat(),fmt_pad_num(),fmt_pct_extra(),fmt_symbol_first(),generate_df(),gt_add_divider(),gt_badge(),gt_double_table(),gt_duplicate_column(),gt_fa_rank_change(),gt_fa_rating(),gt_highlight_cols(),gt_highlight_rows(),gt_img_border(),gt_img_circle(),gt_img_multi_rows(),gt_img_rows(),gt_merge_stack(),gt_merge_stack_color(),gt_two_column_layout(),gtsave_extra(),img_header(),pad_fn(),tab_style_by_grp()
Examples
library(gt)# This is a key step, as gt will create the row groups# based on first observation of the unique row items# this sampling will return a row-group order for cyl of 6,4,8set.seed(1234)sliced_data <- mtcars %>% dplyr::group_by(cyl) %>% dplyr::slice_head(n = 3) %>% dplyr::ungroup() %>% # randomize the order dplyr::slice_sample(n = 9)# not in "order" yetsliced_data$cyl# But unique order of 6,4,8unique(sliced_data$cyl)# creating a standalone basic tabletest_tab <- sliced_data %>% gt(groupname_col = "cyl")# can style a specific column based on the contents of another columntab_out_styled <- test_tab %>% tab_style( locations = cells_body(mpg, rows = gt_index(., am) == 0), style = cell_fill("red") )# OR can extract the underlying data in the "correct order"# according to the internal gt structure, ie arranged by group# by cylinder, 6,4,8gt_index(test_tab, mpg, as_vector = FALSE)# note that the order of the index data is# not equivalent to the order of the input data# however all the of the rows still matchsliced_dataAdd a simple table with column names and matching labels
Description
Add a simple table with column names and matching labels
Usage
gt_label_details(label, content, names = c("Column", "Description"))Arguments
label | A string representing the label for the details expansion section. |
content | A named list or wide data.frame with 2 rows |
names | a string indicating the name of the two columns inside the details tag |
Value
HTML text
Merge and stack text from two columns ingt
Description
Thegt_merge_stack() function takes an existinggt table and mergescolumn 1 and column 2, stacking column 1's text on top of column 2's.Top text is in all caps with black bold text, while the lower text is smallerand dark grey.
Usage
gt_merge_stack( gt_object, col1, col2, palette = c("black", "grey"), ..., small_cap = TRUE, font_size = c("14px", "10px"), font_weight = c("bold", "bold"))Arguments
gt_object | An existing gt table object of class |
col1 | The column to stack on top. Will be converted to all caps, with black and bold text. |
col2 | The column to merge and place below. Will be smaller and dark grey. |
palette | The colors for the text, where the first color is the top ,ie |
... | Arguments passed on to
|
small_cap | a logical indicating whether to use 'small-cap' on the top line of text |
font_size | a string of length 2 indicating the font-size in px of the top and bottom text |
font_weight | a string of length 2 indicating the 'font-weight' of the top and bottom text. Must be one of 'bold', 'normal', 'lighter' |
Value
An object of classgt_tbl.
Examples
library(gt)teams <- "https://github.com/nflverse/nflfastR-data/raw/master/teams_colors_logos.rds"team_df <- readRDS(url(teams))stacked_tab <- team_df %>% dplyr::select(team_nick, team_abbr, team_conf, team_division, team_wordmark) %>% head(8) %>% gt(groupname_col = "team_conf") %>% gt_merge_stack(col1 = team_nick, col2 = team_division) %>% gt_img_rows(team_wordmark)
Figures

Function ID
2-6
See Also
Other Utilities:add_text_img(),fa_icon_repeat(),fmt_pad_num(),fmt_pct_extra(),fmt_symbol_first(),generate_df(),gt_add_divider(),gt_badge(),gt_double_table(),gt_duplicate_column(),gt_fa_rank_change(),gt_fa_rating(),gt_highlight_cols(),gt_highlight_rows(),gt_img_border(),gt_img_circle(),gt_img_multi_rows(),gt_img_rows(),gt_index(),gt_merge_stack_color(),gt_two_column_layout(),gtsave_extra(),img_header(),pad_fn(),tab_style_by_grp()
Merge and stack text with background coloring from two columns ingt
Description
Thegt_merge_stack_color() function takes an existinggt table and mergescolumn 1 and column 2, stacking column 1's text on top of column 2's.This variant also accepts a palette argument to colorize the backgroundvalues.
Usage
gt_merge_stack_color( gt_object, top_val, color_val, palette = c("#512daa", "white", "#2d6a22"), domain = NULL, small_cap = TRUE, font_size = c("14px", "10px"), font_weight = c("bold", "bold"))Arguments
gt_object | An existing gt table object of class |
top_val | The column to stack on top. Will be converted to all caps, with bold text by default. |
color_val | The column to merge and place below, and controls the background color value. Will be smaller by default. |
palette | The colours or colour function that values will be mapped to, accepts a string or named palettes from paletteer. |
domain | The possible values that can be mapped. This can be a simple numeric range (e.g. |
small_cap | a logical indicating whether to use 'small-cap' on the top line of text, defaults to |
font_size | a string of length 2 indicating the font-size in px of the top and bottom text |
font_weight | a string of length 2 indicating the 'font-weight' of the top and bottom text. Must be one of 'bold', 'normal', 'lighter' |
Value
An object of classgt_tbl.
Examples
set.seed(12345) dplyr::tibble( value = sample(state.name, 5), color_by = seq.int(10, 98, length.out = 5) ) %>% gt::gt() %>% gt_merge_stack_color(value, color_by)
Figures

See Also
Other Utilities:add_text_img(),fa_icon_repeat(),fmt_pad_num(),fmt_pct_extra(),fmt_symbol_first(),generate_df(),gt_add_divider(),gt_badge(),gt_double_table(),gt_duplicate_column(),gt_fa_rank_change(),gt_fa_rating(),gt_highlight_cols(),gt_highlight_rows(),gt_img_border(),gt_img_circle(),gt_img_multi_rows(),gt_img_rows(),gt_index(),gt_merge_stack(),gt_two_column_layout(),gtsave_extra(),img_header(),pad_fn(),tab_style_by_grp()
Add bar plots into rows of agt table
Description
Thegt_plt_bar function takes an existinggt_tbl object andadds horizontal barplots viaggplot2. Note that values are plotted on ashared x-axis, and a vertical black bar is added at x = zero. To add labelsto each of the of the bars, setscale_type to either'percent' or'number'.
Usage
gt_plt_bar( gt_object, column = NULL, color = "purple", ..., keep_column = FALSE, width = 40, scale_type = "none", text_color = "white")Arguments
gt_object | An existing gt table object of class |
column | A single column wherein the bar plot should replace existing data. |
color | A character representing the color for the bar, defaults to purple. Accepts a named color (eg |
... | Additional arguments passed to |
keep_column |
|
width | An integer indicating the width of the plot in pixels. |
scale_type | A string indicating additional text formatting and the addition of numeric labels to the plotted bars if not |
text_color | A string indicating the color of text if |
Value
An object of classgt_tbl.
Examples
library(gt)gt_plt_bar_tab <- mtcars %>% head() %>% gt() %>% gt_plt_bar(column = mpg, keep_column = TRUE)

Function ID
3-4
See Also
Other Plotting:gt_plt_bar_pct(),gt_plt_bar_stack(),gt_plt_dist(),gt_plt_percentile(),gt_plt_point(),gt_plt_sparkline(),gt_plt_winloss()
Add HTML-based bar plots into rows of agt table
Description
Thegt_plt_bar_pct function takes an existinggt_tbl object andadds horizontal barplots via native HTML. Note that valuesdefault to being normalized to the percent of the maximum observed valuein the specified column. You can turn this off if the values alreadyrepresent a percentage value representing 0-100.
Usage
gt_plt_bar_pct( gt_object, column, height = 16, width = 100, fill = "purple", background = "#e1e1e1", scaled = FALSE, labels = FALSE, label_cutoff = 0.4, decimals = 1, font_style = "bold", font_size = "10px")Arguments
gt_object | An existing gt table object of class |
column | The column wherein the bar plot should replace existing data. |
height | A number representing the vertical height of the plot in pixels. Defaults to 16 px. |
width | A number representing the horizontal width of the plot in pixels. Defaults to 100 px. Importantly, this interacts with the label_cutoff argument, so if you want to change the cutoff, you may need to adjust the width as well. |
fill | A character representing the fill for the bar, defaults to purple. Accepts a named color (eg 'purple') or a hex color. |
background | A character representing the background filling out the 100% mark of the bar, defaults to light grey. Accepts a named color (eg 'white') or a hex color. |
scaled |
|
labels |
|
label_cutoff | A number, 0 to 1, representing where to set the inside/outside label boundary. Defaults to 0.40 (40%) of the column's maximum value. If the value in that row is less than the cutoff, the label will be placed outside the bar, otherwise it will be placed within the bar. This interacts with the overall width of the bar, so if you are not happy with the placement of the labels you may try adjusting the |
decimals | A number representing how many decimal places to be used in label rounding. Defaults to 1. |
font_style | A character representing the font style of the labels. Accepts one of 'bold' (default), 'italic', or 'normal'. |
font_size | A character representing the font size of the labels. Defaults to '10px'. |
Value
An object of classgt_tbl.
Examples
library(gt)base_tab <- dplyr::tibble(x = seq(1, 100, length.out = 6)) %>% dplyr::mutate( x_unscaled = x, x_scaled = x / max(x) * 100 ) %>% gt()base_tab %>% gt_plt_bar_pct( column = x_unscaled, scaled = TRUE, fill = "forestgreen" ) %>% gt_plt_bar_pct( column = x_scaled, scaled = FALSE, labels = TRUE )
Figures

Function ID
3-5
See Also
Other Plotting:gt_plt_bar(),gt_plt_bar_stack(),gt_plt_dist(),gt_plt_percentile(),gt_plt_point(),gt_plt_sparkline(),gt_plt_winloss()
Add a percent stacked barchart in place of existing data.
Description
Thegt_plt_bar_stack function takes an existinggt_tbl object andconverts the existing values into a percent stacked barchart. The bar chartwill represent either 2 or 3 user-specified values per row, and requiresa list column ahead of time. The palette and labels need to be equal length.The values must either add up to 100 ie as percentage points if usingposition = 'fill', or can be raw values withposition = 'stack'. Note thatthe labels can be controlled via thefmt_fn argument and thescales::label_???() family of function.
Usage
gt_plt_bar_stack( gt_object, column = NULL, palette = c("#ff4343", "#bfbfbf", "#0a1c2b"), labels = c("Group 1", "Group 2", "Group 3"), position = "fill", width = 70, fmt_fn = scales::label_number(scale_cut = cut_short_scale(), trim = TRUE), font = "mono")Arguments
gt_object | An existing gt table object of class |
column | The column wherein the percent stacked barchart should replace existing data. Note that the datamust be represented as a list of numeric values ahead of time. |
palette | A color palette of length 2 or 3, represented either by hex colors ( |
labels | A vector of strings of length 2 or 3, representing the labels for the bar chart, will be colored according to the palette as well. |
position | An string indicator passed to |
width | An integer representing the width of the bar chart in pixels. |
fmt_fn | A specific function from |
font | A string representing the font family of the numbers of the bar labels. Defaults to |
Value
An object of classgt_tbl.
Examples
library(gt)library(dplyr)ex_df <- dplyr::tibble( x = c("Example 1","Example 1", "Example 1","Example 2","Example 2","Example 2", "Example 3","Example 3","Example 3","Example 4","Example 4", "Example 4"), measure = c("Measure 1","Measure 2", "Measure 3","Measure 1","Measure 2","Measure 3", "Measure 1","Measure 2","Measure 3","Measure 1","Measure 2", "Measure 3"), data = c(30, 20, 50, 30, 30, 40, 30, 40, 30, 30, 50, 20))tab_df <- ex_df %>% group_by(x) %>% summarise(list_data = list(data))tab_dfex_tab <- tab_df %>% gt() %>% gt_plt_bar_stack(column = list_data)
See Also
Other Plotting:gt_plt_bar(),gt_plt_bar_pct(),gt_plt_dist(),gt_plt_percentile(),gt_plt_point(),gt_plt_sparkline(),gt_plt_winloss()
Create an inline 'bullet chart' in a gt table
Description
Create an inline 'bullet chart' in a gt table
Usage
gt_plt_bullet( gt_object, column = NULL, target = NULL, width = 65, palette = c("grey", "red"), palette_col = NULL)Arguments
gt_object | An existing gt table object of class |
column | The column where a 'bullet chart' will replace the inline values. |
target | The column indicating the target values that will be represented by a vertical line |
width | Width of the plot in pixels |
palette | Color of the bar and target line, defaults to |
palette_col | An additional column that contains specific colors for the bar colors themselves. Defaults to NULL which skips this argument. |
Value
An object of classgt_tbl.
Examples
set.seed(37)bullet_tab <- tibble::rownames_to_column(mtcars) %>% dplyr::select(rowname, cyl:drat, mpg) %>% dplyr::group_by(cyl) %>% dplyr::mutate(target_col = mean(mpg)) %>% dplyr::slice_sample(n = 3) %>% dplyr::ungroup() %>% gt::gt() %>% gt_plt_bullet(column = mpg, target = target_col, width = 45, palette = c("lightblue", "black")) %>% gt_theme_538()
Function ID
3-7
See Also
Other Themes:gt_plt_conf_int(),gt_plt_dot(),gt_theme_538(),gt_theme_dark(),gt_theme_dot_matrix(),gt_theme_espn(),gt_theme_excel(),gt_theme_guardian(),gt_theme_nytimes(),gt_theme_pff()
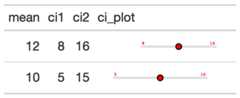
Plot a confidence interval around a point
Description
Plot a confidence interval around a point
Usage
gt_plt_conf_int( gt_object, column, ci_columns, ci = 0.9, ref_line = NULL, palette = c("black", "grey", "white", "black"), width = 45, text_args = list(accuracy = 1), text_size = 1.5)Arguments
gt_object | An existing gt table |
column | The column that contains the mean of the sample. This can either be a single number per row, if you have calculated the values ahead of time, or a list of values if you want to calculate the confidence intervals. |
ci_columns | Optional columns representing the left/right confidence intervals of your sample. |
ci | The confidence interval, representing the percentage, ie |
ref_line | A number indicating where to place reference line on x-axis. |
palette | A vector of color strings of exactly length 4. The colors represent the central point, the color of the range, the color of the stroke around the central point, and the color of the text, in that specific order. |
width | A number indicating the width of the plot in |
text_args | A list of named arguments. Optional text arguments passed as a list to |
text_size | A number indicating the size of the text indicators in the plot. Defaults to 1.5. Can also be set to |
Value
a gt table
Examples
# gtExtras can calculate basic conf int# using confint() functionci_table <- generate_df( n = 50, n_grps = 3, mean = c(10, 15, 20), sd = c(10, 10, 10), with_seed = 37) %>% dplyr::group_by(grp) %>% dplyr::summarise( n = dplyr::n(), avg = mean(values), sd = sd(values), list_data = list(values) ) %>% gt::gt() %>% gt_plt_conf_int(list_data, ci = 0.9)# You can also provide your own values# based on your own algorithm/calculationspre_calc_ci_tab <- dplyr::tibble( mean = c(12, 10), ci1 = c(8, 5), ci2 = c(16, 15), ci_plot = c(12, 10)) %>% gt::gt() %>% gt_plt_conf_int( ci_plot, c(ci1, ci2), palette = c("red", "lightgrey", "black", "red") )Figures

Function ID
3-10
See Also
Other Themes:gt_plt_bullet(),gt_plt_dot(),gt_theme_538(),gt_theme_dark(),gt_theme_dot_matrix(),gt_theme_espn(),gt_theme_excel(),gt_theme_guardian(),gt_theme_nytimes(),gt_theme_pff()
Add distribution plots into rows of agt table
Description
Thegt_plt_dist function takes an existinggt_tbl object andadds summary distribution sparklines viaggplot2. Note that these sparklinesare limited to density, histogram, boxplot or rug/strip charts. If you'rewanting to plot more traditional sparklines, you can usegtExtras::gt_plt_sparkline().
Usage
gt_plt_dist( gt_object, column, type = "density", fig_dim = c(5, 30), line_color = "black", fill_color = "grey", bw = NULL, trim = FALSE, same_limit = TRUE, type_col = NULL)Arguments
gt_object | An existing gt table object of class |
column | The column wherein the sparkline plot should replace existing data. Note that the datamust be represented as a list of numeric values ahead of time. |
type | A string indicating the type of plot to generate, accepts |
fig_dim | A vector of two numbers indicating the height/width of the plot in mm at a DPI of 25.4, defaults to |
line_color | Color for the line, defaults to |
fill_color | Color for the fill of histograms/density plots, defaults to |
bw | The bandwidth or binwidth, passed to |
trim | A logical indicating whether to trim the values in |
same_limit | A logical indicating that the plots will use the same axis range ( |
type_col | A tidyselect column indicating a vector of which |
Value
An object of classgt_tbl.
Examples
library(gt) gt_sparkline_tab <- mtcars %>% dplyr::group_by(cyl) %>% # must end up with list of data for each row in the input dataframe dplyr::summarize(mpg_data = list(mpg), .groups = "drop") %>% gt() %>% gt_plt_dist(mpg_data)
Figures

Function ID
1-4
See Also
Other Plotting:gt_plt_bar(),gt_plt_bar_pct(),gt_plt_bar_stack(),gt_plt_percentile(),gt_plt_point(),gt_plt_sparkline(),gt_plt_winloss()
Add a color dot and thin bar chart to a table
Description
This function takes a data column and a categorical column andadds a colored dot and a colored dot to the categorical column. You can supplya specific palette or a palette from the{paletteer} package.
Usage
gt_plt_dot( gt_object, column, category_column, palette = NULL, max_value = NULL)Arguments
gt_object | An existing gt table object of class |
column | The column which supplies values to create the inline bar plot |
category_column | The category column, where a colored dot and bar will be added |
palette | The colors or color function that values will be mapped to. Can be a character vector (eg |
max_value | A single numeric value indicating the max value, if left as |
Value
agt_tbl
Examples
library(gt)dot_bar_tab <- mtcars %>% head() %>% dplyr::mutate(cars = sapply(strsplit(rownames(.)," "), `[`, 1)) %>% dplyr::select(cars, mpg, disp) %>% gt() %>% gt_plt_dot(disp, cars, palette = "ggthemes::fivethirtyeight") %>% cols_width(cars ~ px(125))
Figures

See Also
Other Themes:gt_plt_bullet(),gt_plt_conf_int(),gt_theme_538(),gt_theme_dark(),gt_theme_dot_matrix(),gt_theme_espn(),gt_theme_excel(),gt_theme_guardian(),gt_theme_nytimes(),gt_theme_pff()
Add a dumbbell plot in place of two columns
Description
Add a dumbbell plot in place of two columns
Usage
gt_plt_dumbbell( gt_object, col1 = NULL, col2 = NULL, label = NULL, palette = c("#378E38", "#A926B6", "#D3D3D3"), width = 70, text_args = list(accuracy = 1), text_size = 2.5)Arguments
gt_object | an existing gt_tbl or pipeline |
col1 | column 1, plot will replace this column |
col2 | column 2, will be hidden |
label | an optional new label for the transformed column |
palette | must be 3 colors in order of col1, col2, bar color |
width | width in mm, defaults to 70 |
text_args | A list of named arguments. Optional text arguments passed as a list to |
text_size | A number indicating the size of the text indicators in the plot. Defaults to 1.5. Can also be set to |
Value
a gt_object table
Examples
head(mtcars) %>% gt() %>% gt_plt_dumbbell(disp, mpg)
Figures

Create a dot plot for percentiles
Description
Creates a percentile dot plot in each row. Can be used as analternative for a 0 to 100% bar plot. Allows for scaling values as well andaccepts a vector of colors for the range of values.
Usage
gt_plt_percentile( gt_object, column, palette = c("#007ad6", "#f0f0f0", "#f72e2e"), width = 25, scale = 1)Arguments
gt_object | An existing gt table |
column | The column to transform to the percentile dot plot. Accepts |
palette | A vector of strings of length 3. Defaults to |
width | A numeric, indicating the width of the plot in |
scale | A number to multiply/scale the values in the column by. Defaults to 1, but can also be 100 if you have decimals. |
Value
a gt table
Examples
library(gt)dot_plt <- dplyr::tibble(x = c(seq(10, 90, length.out = 5))) %>% gt() %>% gt_duplicate_column(x,dupe_name = "dot_plot") %>% gt_plt_percentile(dot_plot)
Figures

Function ID
3-8
See Also
Other Plotting:gt_plt_bar(),gt_plt_bar_pct(),gt_plt_bar_stack(),gt_plt_dist(),gt_plt_point(),gt_plt_sparkline(),gt_plt_winloss()
Create a point plot in place of each value.
Description
Creates a dot/point plot in each row. Can be used as analternative for a bar plot. Accepts any range of values, as opposed togt_plt_percentile which is intended to be used for values between 0 and 100.
Usage
gt_plt_point( gt_object, column, palette = c("#007ad6", "#f0f0f0", "#f72e2e"), width = 25, scale = 1, accuracy = 1)Arguments
gt_object | An existing gt table |
column | The column to transform to the percentile dot plot. Accepts |
palette | A vector of strings of length 3. Defaults to |
width | A numeric, indicating the width of the plot in |
scale | A number to multiply/scale the values in the column by. Defaults to 1, but can also be 100 if you have decimals. |
accuracy | Accuracy of the number labels in the plot, passed to |
Value
a gt table
Examples
point_tab <- dplyr::tibble(x = c(seq(1.2e6, 2e6, length.out = 5))) %>% gt::gt() %>% gt_duplicate_column(x,dupe_name = "point_plot") %>% gt_plt_point(point_plot, accuracy = .1, width = 25) %>% gt::fmt_number(x, suffixing = TRUE, decimals = 1)
Figures

Function ID
3-9
See Also
Other Plotting:gt_plt_bar(),gt_plt_bar_pct(),gt_plt_bar_stack(),gt_plt_dist(),gt_plt_percentile(),gt_plt_sparkline(),gt_plt_winloss()
Add sparklines into rows of agt table
Description
Thegt_plt_sparkline function takes an existinggt_tbl object andadds sparklines via theggplot2. Note that if you'd rather plot summarydistributions (ie density/histograms) you can instead use:gtExtras::gt_plt_dist()
Usage
gt_plt_sparkline( gt_object, column, type = "default", fig_dim = c(5, 30), palette = c("black", "black", "purple", "green", "lightgrey"), same_limit = TRUE, label = TRUE)Arguments
gt_object | An existing gt table object of class |
column | The column wherein the sparkline plot should replace existing data. Note that the datamust be represented as a list of numeric values ahead of time. |
type | A string indicating the type of plot to generate, accepts |
fig_dim | A vector of two numbers indicating the height/width of the plot in mm at a DPI of 25.4, defaults to |
palette | A character string with 5 elements indicating the colors of various components. Order matters, and palette = sparkline color, final value color, range color low, range color high, and 'type' color (eg shading or reference lines). To show a plot with no points (only the line itself), use: |
same_limit | A logical indicating that the plots will use the same axis range ( |
label | A logical indicating whether the sparkline will have a numeric label for the last value in the vector, placed at the end of the plot. |
Value
An object of classgt_tbl.
Examples
library(gt) gt_sparkline_tab <- mtcars %>% dplyr::group_by(cyl) %>% # must end up with list of data for each row in the input dataframe dplyr::summarize(mpg_data = list(mpg), .groups = "drop") %>% gt() %>% gt_plt_sparkline(mpg_data)
Figures

Function ID
1-4
See Also
Other Plotting:gt_plt_bar(),gt_plt_bar_pct(),gt_plt_bar_stack(),gt_plt_dist(),gt_plt_percentile(),gt_plt_point(),gt_plt_winloss()
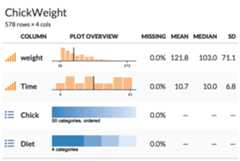
Create a summary table from a dataframe
Description
Create a summary table from a dataframe with inlinehistograms or area bar charts. Inspired by the Observable team andthe observablehq/SummaryTable function: https://observablehq.com/d/d8d2929832202050
Usage
gt_plt_summary(df, title = NULL)Arguments
df | a dataframe or tibble |
title | a character string to be used in the table title |
Value
a gt table
Examples
Create a summary table from adata.frame ortibble.
gt_plt_summary(datasets::ChickWeight)
Add win loss point plot into rows of agt table
Description
Thegt_plt_winloss function takes an existinggt_tbl object andadds squares of a specific color and vertical position based on wins/losses.It is a wrapper aroundgt::text_transform(). The column chosenmust bea list-column as seen in the example code. The column should also only containvalues of 0 (loss), 0.5 (tie), and 1 (win).
Usage
gt_plt_winloss( gt_object, column, max_wins = 17, palette = c("#013369", "#D50A0A", "gray"), type = "pill", width = max_wins/0.83)Arguments
gt_object | An existing gt table object of class |
column | The column wherein the winloss plot should replace existing data. Note that the datamust be represented as a list of numeric values ahead of time. |
max_wins | An integer indicating the max possible wins, this will be used to add padding if the total wins/losses observed is less than the max. This is useful for mid-season reporting. Defaults to a red, blue, grey palette. |
palette | A character vector of length 3, specifying the colors for win, loss, tie in that exact order. |
type | A character string representing the type of plot, either a 'pill' or 'square' |
width | A numeric indicating the width of the plot in |
Value
An object of classgt_tbl.
Examples
#' library(gt)set.seed(37)data_in <- dplyr::tibble( grp = rep(c("A", "B", "C"), each = 10), wins = sample(c(0,1,.5), size = 30, prob = c(0.45, 0.45, 0.1), replace = TRUE)) %>% dplyr::group_by(grp) %>% dplyr::summarize(wins=list(wins), .groups = "drop")data_inwin_table <- data_in %>% gt() %>% gt_plt_winloss(wins)
Function ID
3-1
See Also
Other Plotting:gt_plt_bar(),gt_plt_bar_pct(),gt_plt_bar_stack(),gt_plt_dist(),gt_plt_percentile(),gt_plt_point(),gt_plt_sparkline()
Render 'gt' Table to Temporary png File
Description
Take a gt pipeline or object and print it as an image withina reprex
Usage
gt_reprex_image(gt_object)Arguments
gt_object | An object of class |
Details
Saves a gt table to a temporary png image file and usesknitr::include_graphics() to render tables in reproducible exampleslikereprex::reprex() where the HTML is not transferrable to GitHub.
Value
a png image
Apply FiveThirtyEight theme to a gt table
Description
Apply FiveThirtyEight theme to a gt table
Usage
gt_theme_538(gt_object, ..., quiet = FALSE)Arguments
gt_object | An existing gt table object of class |
... | Optional additional arguments to |
quiet | A logical to silence the warning about missing ID |
Value
An object of classgt_tbl.
Examples
library(gt)themed_tab <- head(mtcars) %>% gt() %>% gt_theme_538()
Figures

Function ID
1-1
See Also
Other Themes:gt_plt_bullet(),gt_plt_conf_int(),gt_plt_dot(),gt_theme_dark(),gt_theme_dot_matrix(),gt_theme_espn(),gt_theme_excel(),gt_theme_guardian(),gt_theme_nytimes(),gt_theme_pff()
Apply dark theme to agt table
Description
Apply dark theme to agt table
Usage
gt_theme_dark(gt_object, ...)Arguments
gt_object | An existing gt table object of class |
... | Optional additional arguments to |
Value
An object of classgt_tbl.
Figures

Function ID
1-6
See Also
Other Themes:gt_plt_bullet(),gt_plt_conf_int(),gt_plt_dot(),gt_theme_538(),gt_theme_dot_matrix(),gt_theme_espn(),gt_theme_excel(),gt_theme_guardian(),gt_theme_nytimes(),gt_theme_pff()
Examples
library(gt)dark_tab <- head(mtcars) %>% gt() %>% gt_theme_dark() %>% tab_header(title = "Dark mode table")Apply dot matrix theme to a gt table
Description
Apply dot matrix theme to a gt table
Usage
gt_theme_dot_matrix(gt_object, ..., color = "#b5dbb6", quiet = FALSE)Arguments
gt_object | An existing gt table object of class |
... | Additional arguments passed to |
color | A string indicating the color of the row striping, defaults to a light green. Accepts either named colors or hex colors. |
quiet | A logical to silence the warning about missing ID |
Value
An object of classgt_tbl.
Examples
library(gt)themed_tab <- head(mtcars) %>% gt() %>% gt_theme_dot_matrix() %>% tab_header(title = "Styled like dot matrix printer paper")
Figures

See Also
Other Themes:gt_plt_bullet(),gt_plt_conf_int(),gt_plt_dot(),gt_theme_538(),gt_theme_dark(),gt_theme_espn(),gt_theme_excel(),gt_theme_guardian(),gt_theme_nytimes(),gt_theme_pff()
Apply ESPN theme to a gt table
Description
Apply ESPN theme to a gt table
Usage
gt_theme_espn(gt_object, ...)Arguments
gt_object | An existing gt table object of class |
... | Optional additional arguments to |
Value
An object of classgt_tbl.
Figures

Function ID
1-2
See Also
Other Themes:gt_plt_bullet(),gt_plt_conf_int(),gt_plt_dot(),gt_theme_538(),gt_theme_dark(),gt_theme_dot_matrix(),gt_theme_excel(),gt_theme_guardian(),gt_theme_nytimes(),gt_theme_pff()
Examples
library(gt)themed_tab <- head(mtcars) %>% gt() %>% gt_theme_espn()Apply Excel-style theme to an existing gt table
Description
Apply Excel-style theme to an existing gt table
Usage
gt_theme_excel(gt_object, ..., color = "lightgrey")Arguments
gt_object | An existing gt table object of class |
... | Additional arguments passed to |
color | A string indicating the color of the row striping, defaults to a light gray Accepts either named colors or hex colors. |
Value
An object of classgt_tbl.
Figures

Function ID
1-7
See Also
Other Themes:gt_plt_bullet(),gt_plt_conf_int(),gt_plt_dot(),gt_theme_538(),gt_theme_dark(),gt_theme_dot_matrix(),gt_theme_espn(),gt_theme_guardian(),gt_theme_nytimes(),gt_theme_pff()
Examples
library(gt)themed_tab <- head(mtcars) %>% gt() %>% gt_theme_excel() %>% tab_header(title = "Styled like your old pal, Excel")Apply Guardian theme to agt table
Description
Apply Guardian theme to agt table
Usage
gt_theme_guardian(gt_object, ...)Arguments
gt_object | An existing gt table object of class |
... | Optional additional arguments to |
Value
An object of classgt_tbl.
Figures

Function ID
1-4
See Also
Other Themes:gt_plt_bullet(),gt_plt_conf_int(),gt_plt_dot(),gt_theme_538(),gt_theme_dark(),gt_theme_dot_matrix(),gt_theme_espn(),gt_theme_excel(),gt_theme_nytimes(),gt_theme_pff()
Examples
library(gt)themed_tab <- head(mtcars) %>% gt() %>% gt_theme_guardian()Apply NY Times theme to agt table
Description
Apply NY Times theme to agt table
Usage
gt_theme_nytimes(gt_object, ...)Arguments
gt_object | An existing gt table object of class |
... | Optional additional arguments to |
Value
An object of classgt_tbl.
Figures

Function ID
1-3
See Also
Other Themes:gt_plt_bullet(),gt_plt_conf_int(),gt_plt_dot(),gt_theme_538(),gt_theme_dark(),gt_theme_dot_matrix(),gt_theme_espn(),gt_theme_excel(),gt_theme_guardian(),gt_theme_pff()
Examples
library(gt)nyt_tab <- head(mtcars) %>% gt() %>% gt_theme_nytimes() %>% tab_header(title = "Table styled like the NY Times")Apply a table theme like PFF
Description
Apply a table theme like PFF
Usage
gt_theme_pff(gt_object, ..., divider, spanners, rank_col)Arguments
gt_object | an existing gt_tbl object |
... | Additional arguments passed to gt::tab_options() |
divider | A column name to add a divider to the left of - accepts tidy-eval column names. |
spanners | Character string that indicates the names of specific spanners you have created with gt::tab_spanner(). |
rank_col | A column name to add a grey background to. Accepts tidy-eval column names. |
Value
gt_tbl
Examples
library(gt) out_df <- tibble::tribble( ~rank, ~player, ~jersey, ~team, ~g, ~pass, ~pr_snaps, ~rsh_pct, ~prp, ~prsh, 1L, "Trey Hendrickson", "91", "CIN", 16, 495, 454, 91.7, 10.8, 83.9, 2L, "T.J. Watt", "90", "PIT", 15, 461, 413, 89.6, 10.7, 90.6, 3L, "Rashan Gary", "52", "GB", 16, 471, 463, 98.3, 10.4, 88.9, 4L, "Maxx Crosby", "98", "LV", 17, 599, 597, 99.7, 10, 91.8, 5L, "Matthew Judon", "09", "NE", 17, 510, 420, 82.4, 9.7, 73.2, 6L, "Myles Garrett", "95", "CLV", 17, 554, 543, 98, 9.5, 92.7, 7L, "Shaquil Barrett", "58", "TB", 15, 563, 485, 86.1, 9.3, 81.5, 8L, "Nick Bosa", "97", "SF", 17, 529, 525, 99.2, 9.2, 89.8, 9L, "Marcus Davenport", "92", "NO", 11, 302, 297, 98.3, 9.1, 82, 10L, "Joey Bosa", "97", "LAC", 16, 495, 468, 94.5, 8.9, 90.3, 11L, "Robert Quinn", "94", "CHI", 16, 445, 402, 90.3, 8.6, 79.7, 12L, "Randy Gregory", "94", "DAL", 12, 315, 308, 97.8, 8.6, 84.4 ) out_df %>% gt() %>% tab_spanner(columns = pass:rsh_pct, label = "snaps") %>% tab_spanner(columns = prp:prsh, label = "grade") %>% gt_theme_pff( spanners = c("snaps", "grade"), divider = jersey, rank_col = rank ) %>% gt_color_box( columns = prsh, domain = c(0, 95), width = 50, accuracy = 0.1, palette = "pff" ) %>% cols_label(jersey = "#", g = "#G", rsh_pct = "RSH%") %>% tab_header( title = "Pass Rush Grades", subtitle = "Grades and pass rush stats" ) %>% gt_highlight_cols(columns = prp, fill = "#e4e8ec") %>% tab_style( style = list( cell_borders("bottom", "white"), cell_fill(color = "#393c40") ), locations = cells_column_labels(prp)Figures

See Also
Other Themes:gt_plt_bullet(),gt_plt_conf_int(),gt_plt_dot(),gt_theme_538(),gt_theme_dark(),gt_theme_dot_matrix(),gt_theme_espn(),gt_theme_excel(),gt_theme_guardian(),gt_theme_nytimes()
Create a two-column layout from a list of two gt tables
Description
This function takes alist() of two gt-tables and returnsthem as a two-column layout. The expectation is that the user either suppliestwo tables likelist(table1, table2), or passes the output ofgt_double_table()into this function. The user should indicate whether they want to return theHTML to R's viewer withoutput = "viewer" to "view" the final output, or tosave to disk as a.png viaoutput = "save". Note that this is a relativelycomplex wrapper aroundhtmltools::div() +webshot2::webshot(). Additionalarguments can be passed towebshot2::webshot() if the automatic output is notsatisfactory. In most situations, modifying thevwidth argument is sufficientto get the desired output, but all arguments towebshot2::webshot() areavailable by their original name via the passed....
Usage
gt_two_column_layout( tables = NULL, output = "viewer", filename = NULL, path = NULL, vwidth = 992, vheight = 600, ..., zoom = 2, expand = 5, tab_header_from = NULL)Arguments
tables | A |
output | A character string indicating the desired output, either |
filename | The filename of the table, must contain |
path | An optional path of where to save the printed |
vwidth | Viewport width. This is the width of the browser "window" when passed to |
vheight | Viewport height This is the height of the browser "window" when passed to |
... | Additional arguments passed to |
zoom | Argument to |
expand | Argument to |
tab_header_from | If |
Value
Saves a.png to disk ifoutput = "save", returns HTML to the viewer viahtmltools::browsable() whenoutput = "viewer", or returns raw HTML ifoutput = "html".
Examples
Add row numbers and drop some columns
library(gt)my_cars <- mtcars %>% dplyr::mutate(row_n = dplyr::row_number(), .before = mpg) %>% dplyr::select(row_n, mpg:drat)
Create two tables, just split half/half
tab1 <- my_cars %>% dplyr::slice(1:16) %>% gt() %>% gtExtras::gt_color_rows(columns = row_n, domain = 1:32)tab2 <- my_cars %>% dplyr::slice(17:32) %>% gt() %>% gtExtras::gt_color_rows(columns = row_n, domain = 1:32)
Put the tables in a list and then pass list to thegt_two_column_layout function.
listed_tables <- list(tab1, tab2)gt_two_column_layout(listed_tables)
A better option - write a small function, usegt_double_table() to generatethe tables and then pass it togt_double_table()
my_gt_fn <- function(x) { gt(x) %>% gtExtras::gt_color_rows(columns = row_n, domain = 1:32)}my_tables <- gt_double_table(my_cars, my_gt_fn, nrows = nrow(my_cars) / 2)This will return it to the viewer
gt_two_column_layout(my_tables)
If you wanted to save it out instead, could use the code below
gt_two_column_layout(my_tables, output = "save", filename = "basic-two-col.png", vwidth = 550, vheight = 620)
Figures

See Also
Other Utilities:add_text_img(),fa_icon_repeat(),fmt_pad_num(),fmt_pct_extra(),fmt_symbol_first(),generate_df(),gt_add_divider(),gt_badge(),gt_double_table(),gt_duplicate_column(),gt_fa_rank_change(),gt_fa_rating(),gt_highlight_cols(),gt_highlight_rows(),gt_img_border(),gt_img_circle(),gt_img_multi_rows(),gt_img_rows(),gt_index(),gt_merge_stack(),gt_merge_stack_color(),gtsave_extra(),img_header(),pad_fn(),tab_style_by_grp()
Use webshot2 to save a gt table as a PNG
Description
Takes existing HTML content, typically additional HTML including a gt table as a PNG via the{webshot2} package.
Usage
gtsave_extra(data, filename, path = NULL, ..., zoom = 2, expand = 5)Arguments
data | HTML content to be saved temporarily to disk |
filename | The name of the file, should end in |
path | An optional path |
... | Additional arguments to |
zoom | A number specifying the zoom factor. A zoom factor of 2 will result in twice as many pixels vertically and horizontally. Note that using 2 is not exactly the same as taking a screenshot on a HiDPI (Retina) device: it is like increasing the zoom to 200 doubling the height and width of the browser window. |
expand | A numeric vector specifying how many pixels to expand the clipping rectangle by. If one number, the rectangle will be expanded by that many pixels on all sides. If four numbers, they specify the top, right, bottom, and left, in that order. |
Value
Prints the HTML content to the RStudio viewer and saves a.png file to disk
Function ID
2-14
See Also
Other Utilities:add_text_img(),fa_icon_repeat(),fmt_pad_num(),fmt_pct_extra(),fmt_symbol_first(),generate_df(),gt_add_divider(),gt_badge(),gt_double_table(),gt_duplicate_column(),gt_fa_rank_change(),gt_fa_rating(),gt_highlight_cols(),gt_highlight_rows(),gt_img_border(),gt_img_circle(),gt_img_multi_rows(),gt_img_rows(),gt_index(),gt_merge_stack(),gt_merge_stack_color(),gt_two_column_layout(),img_header(),pad_fn(),tab_style_by_grp()
Add images as the column label for a table
Description
Add images as the column label for a table
Usage
img_header( label, img_url, height = 60, font_size = 12, palette = c("black", "black"))Arguments
label | A string indicating the label of the column. |
img_url | A string for the image url. |
height | A number indicating the height of the image in pixels. |
font_size | The font size of the label in pixels. |
palette | A vector of two colors, indictating the bottom border color and the text color. |
Value
HTML string
Examples
library(gt)dplyr::tibble( x = 1:5, y = 6:10) %>% gt() %>% cols_label( x = img_header( "Luka Doncic", "https://secure.espn.com/combiner/i?img=/i/headshots/nba/players/full/3945274.png", height = 60, font_size = 14 ) )
Figures

See Also
Other Utilities:add_text_img(),fa_icon_repeat(),fmt_pad_num(),fmt_pct_extra(),fmt_symbol_first(),generate_df(),gt_add_divider(),gt_badge(),gt_double_table(),gt_duplicate_column(),gt_fa_rank_change(),gt_fa_rating(),gt_highlight_cols(),gt_highlight_rows(),gt_img_border(),gt_img_circle(),gt_img_multi_rows(),gt_img_rows(),gt_index(),gt_merge_stack(),gt_merge_stack_color(),gt_two_column_layout(),gtsave_extra(),pad_fn(),tab_style_by_grp()
Get last row id/index even by group
Description
Get last row id/index even by group
Usage
last_row_id(gt_object)Arguments
gt_object | An existing gt table object of class |
Count number of decimals
Description
Count number of decimals
Usage
n_decimals(x)Arguments
x | A value to count decimals from |
Value
an integer
Pad a vector of numbers to align on the decimal point.
Description
This helper function adds whitespace to numeric values so that they canbe aligned on the decimal without requiring additional trailing zeroes.This function is intended to use within thegt::fmt() function.
Usage
pad_fn(x, nsmall = 2, pad0)Arguments
x | A vector of numbers to pad/align at the decimal point |
nsmall | The max number of decimal places to round at/display |
pad0 | A logical, indicating whether to pad the values with trailing zeros. |
Value
Returns a vector of equal length to the input vector
Figures
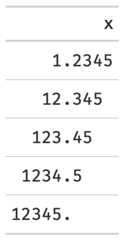
Function ID
2-3
See Also
Other Utilities:add_text_img(),fa_icon_repeat(),fmt_pad_num(),fmt_pct_extra(),fmt_symbol_first(),generate_df(),gt_add_divider(),gt_badge(),gt_double_table(),gt_duplicate_column(),gt_fa_rank_change(),gt_fa_rating(),gt_highlight_cols(),gt_highlight_rows(),gt_img_border(),gt_img_circle(),gt_img_multi_rows(),gt_img_rows(),gt_index(),gt_merge_stack(),gt_merge_stack_color(),gt_two_column_layout(),gtsave_extra(),img_header(),tab_style_by_grp()
Examples
library(gt)padded_tab <- data.frame(x = c(1.2345, 12.345, 123.45, 1234.5, 12345)) %>% gt() %>% fmt(fns = function(x) { pad_fn(x, nsmall = 4) }) %>% tab_style( # MUST USE A MONO-SPACED FONT # https://fonts.google.com/?category=Monospace style = cell_text(font = google_font("Fira Mono")), locations = cells_body(columns = x) )Create inline plots for a summary table
Description
Create inline plots for a summary table
Usage
plot_data(col, col_name, n_missing, ...)Arguments
col | The column of data to be used for plotting |
col_name | the name of the column - use for reporting warnings |
n_missing | Number of missing - used if all missing |
... | additional arguments passed to scales::label_number() |
Value
svg text encoded as HTML
Objects exported from other packages
Description
These objects are imported from other packages. Follow the linksbelow to see their documentation.
- dplyr
%>%,all_of,any_of,contains,ends_with,everything,last_col,matches,mutate,num_range,one_of,select,starts_with,vars
Add table styling to specific rows by group
Description
Thetab_style_by_grp function takes an existinggt_tbl object andstyling according to each group. Currently it support styling themax()/min()for each group.
Usage
tab_style_by_grp(gt_object, column, fn, ...)Arguments
gt_object | An existing gt table object of class |
column | The column using tidy variable name or a number indicating which column should have the styling affect it. |
fn | The name of a summarizing function (ie |
... | Arguments passed to |
Value
An object of classgt_tbl.
Examples
library(gt)df_in <- mtcars %>% dplyr::select(cyl:hp, mpg) %>% tibble::rownames_to_column() %>% dplyr::group_by(cyl) %>% dplyr::slice(1:4) %>% dplyr::ungroup()test_tab <- df_in %>% gt(groupname_col = "cyl") %>% tab_style_by_grp(mpg, fn = max, cell_fill(color = "red", alpha = 0.5))
Figures

Function ID
2-12
See Also
Other Utilities:add_text_img(),fa_icon_repeat(),fmt_pad_num(),fmt_pct_extra(),fmt_symbol_first(),generate_df(),gt_add_divider(),gt_badge(),gt_double_table(),gt_duplicate_column(),gt_fa_rank_change(),gt_fa_rating(),gt_highlight_cols(),gt_highlight_rows(),gt_img_border(),gt_img_circle(),gt_img_multi_rows(),gt_img_rows(),gt_index(),gt_merge_stack(),gt_merge_stack_color(),gt_two_column_layout(),gtsave_extra(),img_header(),pad_fn()
A helper to add basic tooltip inside a gt table
Description
This is a lightweight helper to add tooltip, typically to beused withingt::cols_label().
Usage
with_tooltip(label, tooltip)Arguments
label | The label for the item with a tooltip |
tooltip | The text based tooltip for the item |
Value
HTML text