ggmap is an R package that makes it easy to retrieveraster map tiles from popular online mapping services likeGoogleMaps,Stadia Maps, andOpenStreetMap, and plot themusing theggplot2framework.
Stadia Maps offers map tiles in several styles, including updatedtiles from Stamen Design. AnAPI key is required, but no credit card is necessary tosign up and there is afree tier for non-commercial use. Once you have your API key, invoke theregistration function:register_stadiamaps("YOUR-API-KEY", write = FALSE). Notethat settingwrite = TRUE will update your~/.Renviron file by replacing/adding the relevant line. Ifyou use the former, know that you’ll need to re-do it every time youreset R.
Your API key isprivate and unique to you, so be careful notto share it online, for example in a GitHub issue or saving it in ashared R script file. If you share it inadvertently, just go toclient.stadiamaps.com, delete your API key, and create a new one.
library("ggmap")# Loading required package: ggplot2# ℹ Google's Terms of Service: <https://mapsplatform.google.com># Stadia Maps' Terms of Service: <https://stadiamaps.com/terms-of-service># OpenStreetMap's Tile Usage Policy: <https://operations.osmfoundation.org/policies/tiles># ℹ Please cite ggmap if you use it! Use `citation("ggmap")` for details.us<-c(left =-125,bottom =25.75,right =-67,top =49)get_stadiamap(us,zoom =5,maptype ="alidade_smooth")|>ggmap()# ℹ © Stadia Maps © Stamen Design © OpenMapTiles © OpenStreetMap contributors.
Useqmplot() in the same way you’d useqplot(), but with a map automatically added in thebackground:
library("dplyr",warn.conflicts =FALSE)library("forcats")# define helper`%notin%`<-function(lhs, rhs)!(lhs%in% rhs)# reduce crime to violent crimes in downtown houstonviolent_crimes<- crime|>filter( offense%notin%c("auto theft","theft","burglary"),between(lon,-95.39681,-95.34188),between(lat,29.73631,29.78400) )|>mutate(offense =fct_drop(offense),offense =fct_relevel(offense,c("robbery","aggravated assault","rape","murder")) )# use qmplot to make a scatterplot on a mapqmplot(lon, lat,data = violent_crimes,maptype ="stamen_toner_lite",color =I("red"))# ℹ Using `zoom = 14`# ℹ © Stadia Maps © Stamen Design © OpenMapTiles © OpenStreetMap contributors.
Oftenqmplot() is easiest because it automaticallycomputes a nice bounding box for you without having to pre-compute itfor yourself, get a map, and then useggmap(map) in placeof where you would ordinarily (in aggplot2formulation) useggplot(). Nevertheless, doing it yourselfis more efficient. In that workflow you get the map first (and you canvisualize it withggmap()):
bbox<-make_bbox(lon, lat,data = violent_crimes)map<-get_stadiamap(bbox = bbox,maptype ="stamen_toner_lite",zoom =14 )# ℹ © Stadia Maps © Stamen Design © OpenMapTiles © OpenStreetMap contributors.ggmap(map)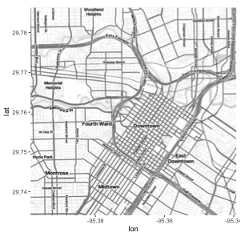
And then you layer on geoms/stats as you would withggplot2. The only difference is that (1) you need tospecify thedata arguments in the layers and (2) thespatial aestheticsx andy are set tolon andlat, respectively. (If they’re namedsomething different in your dataset, just putmapping = aes(x = longitude, y = latitude)), forexample.)
ggmap(map)+geom_point(data = violent_crimes,color ="red")
Withggmap you’re working withggplot2, so you can add in other kinds of layers, usepatchwork,etc. All theggplot2 geom’s are available. For example,you can make a contour plot withgeom = "density2d":
library("patchwork")library("ggdensity")robberies<- violent_crimes|>filter(offense=="robbery")points_map<-ggmap(map)+geom_point(data = robberies,color ="red")# warnings disabledhdr_map<-ggmap(map)+geom_hdr(aes(lon, lat,fill =after_stat(probs)),data = robberies,alpha = .5 )+ geomtextpath::geom_labeldensity2d(aes(lon, lat,level =after_stat(probs)),data = robberies,stat ="hdr_lines",size =3,boxcolour =NA )+scale_fill_brewer(palette ="YlOrRd")+theme(legend.position ="none")(points_map+ hdr_map)&theme(axis.title =element_blank(),axis.text =element_blank(),axis.ticks =element_blank())
Faceting works, too:
ggmap(map,darken = .3)+geom_point(aes(lon, lat),data = violent_crimes,shape =21,color ="gray25",fill ="yellow" )+facet_wrap(~ offense,nrow =1)+theme(axis.title =element_blank(),axis.text =element_blank(),axis.ticks =element_blank())
GoogleMaps can be used just as easily. However, since Google Maps use acenter/zoom specification, their input is a bit different:
(map<-get_googlemap("waco texas",zoom =12))# ℹ <https://maps.googleapis.com/maps/api/staticmap?center=waco%20texas&zoom=12&size=640x640&scale=2&maptype=terrain&key=xxx># ℹ <https://maps.googleapis.com/maps/api/geocode/json?address=waco+texas&key=xxx># 1280x1280 terrain map image from Google Maps; use `ggmap::ggmap()` to plot it.ggmap(map)
Moreover, you can get various different styles of Google Maps withggmap (just like Stadia Maps):
get_googlemap("waco texas",zoom =12,maptype ="satellite")|>ggmap()get_googlemap("waco texas",zoom =12,maptype ="hybrid")|>ggmap()get_googlemap("waco texas",zoom =12,maptype ="roadmap")|>ggmap()Google’s geocoding and reverse geocoding API’s are available throughgeocode() andrevgeocode(), respectively:
geocode("1301 S University Parks Dr, Waco, TX 76798")# ℹ <https://maps.googleapis.com/maps/api/geocode/json?address=1301+S+University+Parks+Dr,+Waco,+TX+76798&key=xxx># # A tibble: 1 × 2# lon lat# <dbl> <dbl># 1 -97.1 31.6revgeocode(c(lon =-97.1161,lat =31.55098))# ℹ <https://maps.googleapis.com/maps/api/geocode/json?latlng=31.55098,-97.1161&key=xxx># Warning: Multiple addresses found, the first will be returned:# ! 1301 S University Parks Dr, Waco, TX 76706, USA# ! 55 Baylor Ave, Waco, TX 76706, USA# ! 1437 S University Parks Dr, Waco, TX 76706, USA# ! HV2M+9H Waco, TX, USA# ! Bear Trail, Waco, TX 76706, USA# ! Waco, TX 76706, USA# ! Waco, TX, USA# ! McLennan County, TX, USA# ! Texas, USA# ! United States# [1] "1301 S University Parks Dr, Waco, TX 76706, USA"Note:geocode() uses Google’s Geocoding API togeocode addresses. Please take care not to disclose sensitiveinformation. Rundle, Bader, and Moody (2022)(https://pmc.ncbi.nlm.nih.gov/articles/PMC8972108/) haveconsidered this issue and suggest various alternative options for suchdata.
There is also amutate_geocode() that works similarly todplyr’smutate() function:
tibble(address =c("white house","","waco texas"))|>mutate_geocode(address)# ℹ <https://maps.googleapis.com/maps/api/geocode/json?address=white+house&key=xxx># ℹ <https://maps.googleapis.com/maps/api/geocode/json?address=waco+texas&key=xxx># # A tibble: 3 × 3# address lon lat# <chr> <dbl> <dbl># 1 "white house" -77.0 38.9# 2 "" NA NA# 3 "waco texas" -97.1 31.6Treks use Google’s routing API to give you routes(route() andtrek() give slightly differentresults; the latter hugs roads):
trek_df<-trek("houson, texas","waco, texas",structure ="route")# ℹ <https://maps.googleapis.com/maps/api/directions/json?origin=houson,+texas&destination=waco,+texas&key=xxx&mode=driving&alternatives=false&units=metric>qmap("college station, texas",zoom =8)+geom_path(aes(x = lon,y = lat),colour ="blue",size =1.5,alpha = .5,data = trek_df,lineend ="round" )# ℹ <https://maps.googleapis.com/maps/api/staticmap?center=college%20station,%20texas&zoom=8&size=640x640&scale=2&maptype=terrain&language=en-EN&key=xxx># ℹ <https://maps.googleapis.com/maps/api/geocode/json?address=college+station,+texas&key=xxx># Warning: Using `size` aesthetic for lines was deprecated in ggplot2 3.4.0.# ℹ Please use `linewidth` instead.# This warning is displayed once every 8 hours.# Call `lifecycle::last_lifecycle_warnings()` to see where this warning was# generated.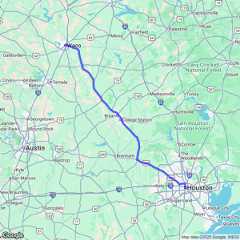
(They also provide information on how long it takes to get from pointA to point B.)
Map distances, in both length and anticipated time, can be computedwithmapdist()). Moreover the function is vectorized:
mapdist(c("houston, texas","dallas"),"waco, texas")# ℹ <https://maps.googleapis.com/maps/api/distancematrix/json?origins=dallas&destinations=waco,+texas&key=xxx&mode=driving># ℹ <https://maps.googleapis.com/maps/api/distancematrix/json?origins=houston,+texas&destinations=waco,+texas&key=xxx&mode=driving># # A tibble: 2 × 9# from to m km miles seconds minutes hours mode# <chr> <chr> <int> <dbl> <dbl> <int> <dbl> <dbl> <chr># 1 dallas waco, texas 151451 151. 94.1 5010 83.5 1.39 driving# 2 houston, texas waco, texas 295079 295. 183. 10112 169. 2.81 drivingA few years ago Google haschangedits API requirements, andggmap users are nowrequired to register with Google. From a user’s perspective, there areessentially three ramifications of this:
Users must register with Google. You can do this athttps://mapsplatform.google.com. While it will require avalid credit card (sorry!), there seems to be a fair bit of free usebefore you incur charges, and even then the charges are modest for lightuse.
Users must enable the APIs they intend to use. What may appear toggmap users as one overarching “Google Maps” product,Google in fact has several services that it provides as geo-relatedsolutions. For example, theMapsStatic API provides map images, while theGeocodingAPI provides geocoding and reverse geocoding services. Apart fromthe relevant Terms of Service, generallyggmap usersdon’t need to think about the different services. For example, you justneed to remember thatget_googlemap() gets maps,geocode() geocodes (with Google, DSK is done), etc., andggmap handles the queries for you.However,you do need to enable the APIs before you use them. You’ll only need todo that once, and then they’ll be ready for you to use. Enabling theAPIs just means clicking a few radio buttons on the Google Maps Platformweb interface listed above, so it’s easy.
Inside R, after loading the new version ofggmap, you’ll need provideggmap withyour API key, ahash value (thinkstring of jibberish) that authenticates you to Google’s servers. Thiscan be done on a temporary basis withregister_google(key = "[your key]") or permanently usingregister_google(key = "[your key]", write = TRUE) (note:this will overwrite your~/.Renviron file byreplacing/adding the relevant line). If you use the former, know thatyou’ll need to re-do it every time you reset R.
Your API key isprivate and unique to you, so be careful notto share it online, for example in a GitHub issue or saving it in ashared R script file. If you share it inadvertantly, just get onGoogle’s website and regenerate your key - this will retire the old one.Keeping your key private is made a bit easier byggmapscrubbing the key out of queries by default, so when URLs are shown inyour console, they’ll look something likekey=xxx. (Readthe details section of theregister_google() documentationfor a bit more info on this point.)
The new version ofggmap is now on CRAN soon, butyou can install the latest version, including an important bug fix inmapdist(), here with:
if(!requireNamespace("devtools"))install.packages("devtools")devtools::install_github("dkahle/ggmap")From CRAN:install.packages("ggmap")
From Github:
if (!requireNamespace("remotes"))install.packages("remotes")remotes::install_github("dkahle/ggmap")